Volume 2 · Closing Lecture
Research Products in Economics
Diego Puga · CEMFI
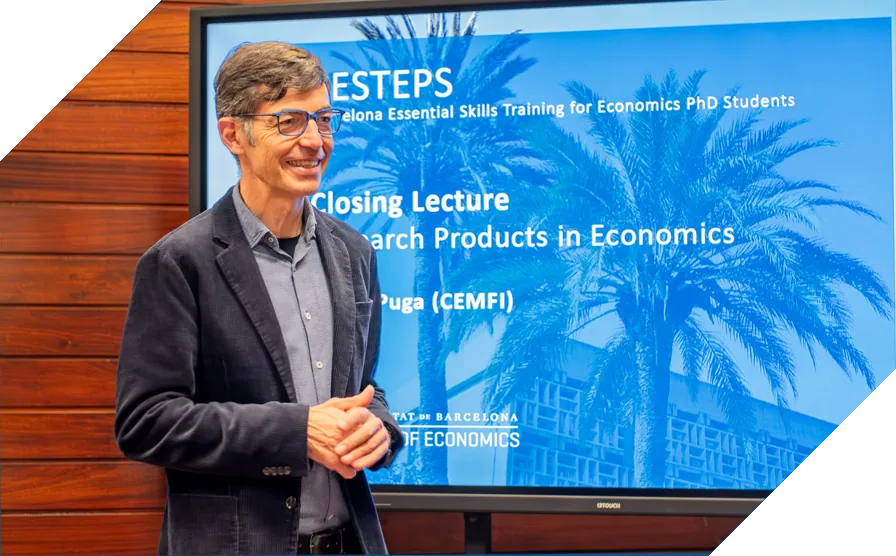
Lecturer: Diego Puga. Diego is currently a Professor at CEMFI and a leading scholar in urban economics, economic geography, and international trade. His research has been published in top academic journals and has also served in editorial roles at several major journals. Beyond academia, Diego has been deeply involved in policy work at both national and international levels, and is currently a member of Spain’s Council of Economic Advisers.
Throughout this Guide, we have learned how to navigate the research process, generate and refine ideas, organize the workflow, visualize findings, deliver presentations, and craft a Job Market Paper. This closing lecture ties these threads together by shifting the lens to building research products. A paper is one product among several; elevator pitches, presentations, job market talks, and policy briefs are all distinct outputs that a researcher must learn to craft. What unites them is that every product must convey a story based on credible research. This lecture first addresses how to select a research project promising to turn into a research product. It then covers various academic products according to their length (short versus long) and medium (written versus oral), showing how the same core elements scale and adapt across formats, and briefly discuss policy-oriented products.
Contents of this lecture:
Before the Product
Building a research product starts with having a research project, but not every project translates into a compelling product. Before discussing various research products in economics, it is worth asking what characteristics make a project more promising than others and what we should do as projects evolve.
Selecting a Project
Be creative and daring. As a PhD student, your most important research product will be the Job Market Paper. From the experience of evaluating many job-market candidates, hiring committees are far more impressed by candidates who have a novel JMP, where they have tried to do something different, even if it is maybe rough on the edges and less polished, than by someone with a paper that is technically polished but makes only a marginal advance.
Of course, difficult things can fail more likely. Trying to tackle a difficult question and succeeding only in part can still demonstrate originality, courage, and the potential to do important work, which can already be enough to earn a flyout. Even a completely failed project is a learning process. The person willing to tackle new and difficult things is someone who will sooner or later do something important. And that’s exactly what is valuable to show for a young researcher.
To have a creative project, start with an actual research question1, not with a method or a dataset. It is tempting to begin from a method you want to apply or a dataset you have gained access to, and that is fine as a starting point, but it is usually much more productive to let the question come first and then search for the tools and data that best serve it.
Your motivation should come primarily from the real world rather than the literature. Typically, it would be things that interest you, and people really notice when you genuinely care about the research, the question, and the answer, or just doing something mechanical. Saying “people have done X and I will do it differently” is fine, but saying something concrete about the world and why it matters is always more compelling. Caring is two-sided. It is partly about excitement and partly about investing deeply: reading, thinking, and learning every detail of your context.
This requires that you develop deep knowledge of your context, to know the ecosystem, and invest in that. Especially in applied fields like development, economic history, and labor economics, there is a tradition of researchers being deeply invested in institutional details. Superficial approaches like “I have this data and these regressions, but I have never been to that country” are increasingly common and increasingly penalized.
Rethinking your Project: Mind the “History Trap”
Most research projects change substantially over time. The initial idea, the initial prototype of a project, is hardly ever the best. There is a solid reason behind: good research is about discovery. If you knew from the beginning exactly what you would end up doing, it probably would not be that surprising.
We all acknowledge that progress usually comes from adjusting the approach, redefining the focus, or rethinking key choices along the way. However, probably the single biggest mistake researchers make is letting your product reflect the history of how you did the project. At some point, it is useful to stop refining the existing draft and instead rethink the paper from the reader’s perspective, asking how the story should be told if it were written from scratch.
The antidote is a simple question: This is my result, this is my story. What is the best way to communicate this if I were to do it from scratch? And sometimes it is actually good to do it from the ground! For example, when writing a paper, this sometimes means setting the old introduction aside entirely, sketching a new structure, and only then recovering pieces from the previous version.
This is important because it is easy to get trapped by the history of the thing. It’s easy to think about it only from your own point of view as someone who researched, as opposed to someone who is coming in for the first time and trying to understand what you’re up to. Therefore, keep an open eye and keep rethinking the project. Always ask yourself from time to time: “Is this the best thing I can do with this? Is this the right way to do it?” Always think of people who have seen this before: what’s the best way to tell them the story?
General Advice for Junior Researchers
Before diving into different research products, here are some additional suggestions. First, at this stage of the career, it’s important always to keep a balance between two things: breadth and steady progress. Intellectual breadth is important at this stage. Reading papers, attending seminars, and taking courses outside of your core area can generate ideas through unexpected connections across different things.
At the same time, be realistic. Writing a good paper takes time. Eventually, you will finish your PhD and need to look for a job. By then, you will need a product to sell. Most researchers discover the “right version” of the paper through trial, error, and iteration. Besides, if you have some margin, even just several extra months, there will be time to really communicate your product and have it in a shape that people can understand.
Finally, seek opportunities to collaborate. Working with other students or with senior faculty is enjoyable, educational, and exposes you to different ways of thinking. Early connections are important because they are likely to last for your career. You keep seeing the same people for years, and you work together, sometimes you don’t, but you still keep in touch and collaborate.
Academic Products: an Overview
Every research product tells a story, and every story is told in multiple formats: the paper itself, seminar presentations, meetings with advisors, elevator conversations at conferences, poster sessions, meetings with visiting speakers, and eventually job-market interviews and talks. Each of these academic research products has its own special advantages and constraints, but they also share many elements. They differ along two dimensions:
Length. A short product conveys the essence in under a minute of reading or speaking (roughly 100 words). A long product takes several minutes to read or deliver (roughly 2–3 pages, or the first few minutes of a talk).
Medium. A written product (abstract, introduction) is polished prose that must work on the page without the author’s voice. A verbal conversational product (elevator pitch, seminar opening, job market spiel) must work in real time with interruptions, body language, and audience interaction.
These two dimensions produce four cells:
| Written | Oral | |
|---|---|---|
| Short | Abstract | Elevator pitch |
| Long | Introduction | Presentation Opening / Job Market Talk |
The short and long versions are the primary axis. Within each, the written and oral versions are structurally parallel: the abstract is essentially the script for the elevator pitch, and the introduction is the blueprint for the seminar opening. They receive disproportionate attention compared to other parts in the paper or the presentation, because they often determine whether an audience engages further. Many principles for the written product extend naturally to oral and informal communication. Mastering one helps you master the other. The following sections take each row in turn, before briefly discussing some principles of the full, longest version: the paper. Later, we will also explore a parallel category, policy-oriented products, which sits outside the academic grid.
Remember, these products are all about communicating your research. Some researchers treat communication as secondary, as “marketing” rather than “real research”. But communicating research is not a secondary or superficial task. It is an essential part of the research process. You are selling something you care about, something you trust, something you believe is good. If the author does not articulate that story, no one else is going to do it for you, and all of those months and years of effort working on a project will be lost.
Start Early, Revise Often
Take the written format as an example. When you have your tables and figures, or your model and propositions, getting some words around that is relatively straightforward. Yet writing the abstract, the introduction, and the conclusion is much more difficult to do. But they are key because those are what people read first, and if you don’t do it well, it will also be what they read last.
For this reason, it is important to devote time to drafting them right from the beginning. Even if they don’t say what the results are because we don’t know yet, the motivation is there, the question is there, and the methodology is there. This early draft serves a double purpose: it forces you to articulate what the project is about, and it ensures that the abstract exists from the start.
Every time you write a section, come back to the abstract and the introduction, keep working on them, and redo and polish them. Every time you write another section of the paper, come back to the abstract and revise it. Same for their spoken counterparts. Every time you present the project, notice which phrasings land and which fall flat, and update accordingly. By the end, hopefully, they are well done as you have spent time on them, without having to rush the night before submission.
As a reminder, it is tempting, especially in the final months before the job market, to keep adding robustness checks and extensions. Resist this. Of course, having a good paper with lots of extensions and robustness is important. The marginal return to a better-written, better-motivated, better-structured abstract is almost always higher than the marginal return to one more robustness check.
The Short Academic Product: Abstract and Elevator Pitch
The abstract and the elevator pitch are two expressions of the same product. They are the most important piece of communication you will produce. The abstract is what sits on the cover page of the paper; the elevator pitch is what you say when someone at a conference asks “So what are you working on?” when you meet a visiting seminar speaker, or in the opening minutes of a job-market interview. In each case, you have roughly one minute and the same elements to deliver.
The short product is your way through the door. It takes time, it takes practice, but because it is short and structured and always has the same elements, if you are disciplined in terms of knowing “this is roughly the words I have, these are the elements that I have”, it’s feasible to do it and to do it well. If it fails to engage, the opportunity to communicate the research is lost. Once you are in, you can spend time on the details. But again, you first need to get in.
Three Elements, One Limit
Good abstracts are surprisingly rare. Even candidates who can explain their project clearly in a two-minute conversation often have abstracts that are too long, poorly structured, and hard to read. There used to be a rule, imposed by the Journal of Economic Literature when it collected abstracts from other journals, that abstracts could not exceed 100 words. Like the old character limit on social media platforms, this constraint was useful precisely because it forced researchers to distilltheir message to its essence. A practical approach is to draft a version of 150 to 200 words and then condense it.
A strong short product, whether written or spoken, contains three elements:
Purpose: a clear statement of the research question and its importance.
Methodology: a brief description of the methodology used to address the question.
Findings: a high-level summary of the main findings and why they matter.
Because the structures are parallel, preparing one well prepares you for the other. A tightly written 100-word abstract almost reads itself aloud as a pitch. Conversely, if you can explain your project clearly in 60 seconds of speech, you have the raw material for a strong abstract. If you need more words, the message is not yet sharp enough.
Examples: The best way to internalise what makes a good short product is to study well-crafted examples. The following four abstracts, drawn from different top journals, topics, and methods, all execute the three-element structure of a short academic product.
The Welfare Effects of Transportation Infrastructure Improvements, Allen and Arkolakis (2022, REStud)
Abstract: Each year in the US, hundreds of billions of dollars are spent on transportation infrastructure, and billions of hours are lost in traffic. We develop a quantitative general equilibrium spatial framework featuring endogenous transportation costs and traffic congestion and apply it to evaluate the welfare impact of transportation infrastructure improvements. Our approach yields analytical expressions for transportation costs between any two locations, the traffic along each link of the transportation network, and the equilibrium distribution of economic activity across the economy, each as a function of the underlying quality of infrastructure and the strength of traffic congestion. We characterize the properties of such an equilibrium and show how the framework can be combined with traffic data to evaluate the impact of improving any segment of the infrastructure network. Applying our framework to both the US highway network and the Seattle road network, we find highly variable returns to investment across different links in the respective transportation networks, highlighting the importance of well-targeted infrastructure investment.
The abstract opens with a vivid motivation: Each year in the U.S., hundreds of billions of dollars are spent on transportation infrastructure, and billions of hours are lost in traffic. One sentence, and the reader knows why this matters. Then the method: a quantitative general equilibrium spatial framework with endogenous transportation costs and congestion. Lastly, the finding: highly variable returns to investment across different links, which immediately implies that careful analysis matters for policy. Purpose, methodology, findings: all present, all clear.
The Political Economics of Green Transitions, Besley and Persson (2023, QJE)
Abstract: Reducing the emissions of greenhouse gases may be almost impossible without a green transition—a substantial transformation of consumption and production patterns. To study such transitions, we propose a dynamic model, which differs from the common approach in economics in two ways. First, consumption patterns reflect not just changing prices and taxes, but changing values. Transitions of values and technologies create a dynamic complementarity that can help or hinder a green transition. Second, and unlike fictitious social planners, policy makers in democratic societies cannot commit to future policy paths, as they are subject to regular elections. We show that market failures and government failures can interact to prevent a welfare-increasing green transition from materializing or make an ongoing green transition too slow.
They first present the motivation/hook: Reducing the emissions of greenhouse gases may be almost impossible without a green transition, where they define the term explicitly, ensuring every reader follows. Then the method: “a dynamic model” differing from the common approach in two specific ways (changing values, not just prices and taxes; democratic policymakers, not social planners), with the contribution relative to existing literature is woven into it. Lastly, the finding: market failures and government failures can interact to prevent or slow a welfare-increasing green transition.
Production Networks, Geography, and Firm Performance, Bernard, Moxnes, and Saito (2019, JPE)
Abstract: This paper examines the importance of buyer-supplier relationships for firm performance. We develop a model in which firms outsource tasks and search for suppliers. Lower search and outsourcing costs lead firms to search more and find better suppliers, which in turn drives down marginal costs. We test the theory by exploiting the opening of a high-speed train line in Japan, which lowered the cost of passenger travel but left shipping costs unchanged. Using an exhaustive data set on firms’ buyer-seller linkages, we find significant improvements in firm performance as well as the creation of buyer-seller links, consistent with the model.
The first sentence states the paper’s purpose: This paper examines the importance of buyers and suppliers for firm performance. Again, one sentence, and you know exactly what the paper is about. Then it presents the method: combining a model of outsourcing and supplier search with a natural experiment, the opening of a high-speed train in Japan. Lastly, the finding: significant improvements in firm performance as well as the creation of buyer-seller links, consistent with the model.
What Drives Media Slant? Evidence from U.S. Daily Newspapers, Gentzkow and Shapiro (2010, ECTA)
Abstract: We construct a new index of media slant that measures the similarity of a news outlet’s language to that of a congressional Republican or Democrat. We estimate a model of newspaper demand that incorporates slant explicitly, estimate the slant that would be chosen if newspapers independently maximized their own profits, and compare these profit-maximizing points with firms’ actual choices. We find that readers have an economically significant preference for like-minded news. Firms respond strongly to consumer preferences, which account for roughly 20 percent of the variation in measured slant in our sample. By contrast, the identity of a newspaper’s owner explains far less of the variation in slant.
Here, the novel measurement strategy is explained up front: an index comparing a news outlet’s language to that of congressional Republicans or Democrats. Then: a demand model that estimates profit-maximising slant. The key result is immediately memorable: consumer preferences account for over 20% of variation in slant, while owner identity explains far less. The abstract is short, yet the research question, the method, and the findings are all unambiguous.
Across all four examples, you see a very clear format. The elements are always the same. First, some motivation and a question. Second, since you’re going to end up talking about what you find, it cannot be just pulling a rabbit out of a hat, but needs to be a research output that people can trust. So you need to give a hint about the methodology. And then finally, the findings, then the actual core results. Sometimes they give you a number, often none. So it’s a very high-level summary of the findings. Typically, it also contains a hint of why the research is important.
The Long Academic Product: Introduction and Spiel
The long product extends the short product into a richer, more structured argument. For the written format, this would be the introduction of a paper, which is the most important and most difficult section to write. In terms of oral communication, the opening minutes of a seminar serve the same function. Besides, in a job-market interview, where you typically enter a Zoom meeting with a panel, you will be asked to “tell us about your research”. The first bit of the job market spiel is also going to be similar.
Canonical Templates and Essential Elements
Below are two well-known frameworks for structuring an introduction, both capturing the essential ingredients. Essentially, they have the same elements: attracting the reader’s interest, stating the research question clearly, situating the paper within prior work, explaining its contribution, and sometimes outlining the paper’s structure.
| Element | Keith Head’s Formula | Don Cox’s “Big Five” |
|---|---|---|
| 1 | Hook | Tell your research question immediately. |
| 2 | Question | Justify its importance. |
| 3 | Antecedents | Spell out the deficiencies in previous work. |
| 4 | Value Added | Explain what you are doing that’s better. |
| 5 | Roadmap | Summarize your results right up front. |
1) Hook and Question There are two ways to structure the first part of the introduction. One way to go is to first give the hook, something that provides motivation, and then go to the specific. The second possibility is to start from the very specific, your research question, and then go broader and explain why it matters. Both work.
A hook is used to grab people’s attention by telling them that the paper tackles something important. It is important to keep it short. But be aware that a very broad motivation (“inequality is important”) is not a hook or motivation; a narrow, vivid fact tied directly to your project is. Some researchers seem to be worried about revealing too much too early, but remember, you are not writing a mystery novel!
For the question, people need to know explicitly what the paper is about in the first paragraph of the paper. A good way to write this is to start with one sentence and then go into more detail, because formulating the whole question should be longer, maybe one or two paragraphs. It’s important to separate the question from the answer, so make sure you fully state your question before you actually start answering it.
2) Answer: method, results, and takeaway After fully stating the question, you need to talk about your answer and how you reached it. Therefore, you need to build trust by explaining the method: the type of model, the data, the key source of variation, and the identification strategy. Then state the results, identifying one key takeaway the reader can remember. When doing so, do not be afraid of committing to a clear message. There will always be caveats, but the core takeaway should be unmistakable. Restrict yourself to one or two numbers; more detail belongs in the body. Aim to keep the full introduction to roughly two pages.
3) Literature and Contribution The third part of the introduction is devoted to positioning your paper in the literature. Discussion of prior work should be selective and purposeful. The goal is not to cite everything, but to establish the foundations for the paper’s contribution. Every reference should answer a question of the reader: What do I need to know about prior work so that I understand what is new about yours? References that do not serve this purpose can be mentioned later in the paper.
You need to explain what is important about what people have done before, give credit where credit is due, but also make clear what the shortcomings are, especially shortcomings that you are going to address. If there is a closely related or similar paper that you need to differentiate yours from, the best person to do it is yourself. Do it explicitly as opposed to hiding it.
Literature review and the contribution part often come together. A way to state contribution while giving credit to prior work could be: “They did this, which is very important for this reason. However, they had this shortcoming, and my research is new because I solved this problem”. Note that the contribution is different from the main findings. The findings are the results. Implicitly or explicitly, this is the place where you should give an argument for why the paper should be published.
4) Limitations and Roadmap No paper is the final word on something; there’s always going to be shortcomings. If there are shortcomings you cannot fully resolve, it is often better to acknowledge them in the introduction and explain why they should not be overly worrying, rather than simply ignoring them. You know the paper better than anybody; you can find the argument better. But keep the focus on the main issues, as the introduction is not the place to defend against every possible criticism.
Typically, you finish the introduction with a roadmap. However, if the roadmap is very standard, such as “data, methodology, results, conclusions”, then you might skip it. If you have already described what you do very linearly, you can also skip it to avoid redundancy.
Once you have a complete draft of the long product, perform a systematic coherence check. A well-written paper forms a coherent whole. The research question, the answer, and the discussion of prior work should reinforce one another. Useful consistency checks include asking yourself some questions: Does the motivation make readers care about your specific question? Does the answer really read as an answer to that question, or to a subtly different one? If a reader saw only the shortcomings you identify in prior work, would they already guess what your paper does? Does the description of your contribution match the gaps you outlined? Making sure all the pieces fit together.
Bonus: Rest of the Paper
The long written product naturally extends beyond the introduction into the body and conclusion of the paper. While the abstract and introduction are the most difficult and highest-return sections to write, the rest of the manuscript also constitutes part of the research product and should be crafted accordingly.
Paper structure Standard structures exist for empirical and theoretical papers. If you deviate, have a good reason, because readers will expect the convention.
Applied empirical paper: Introduction → Background → Model/Empirical Strategy → Data → Results (possibly split into multiple sections) → Conclusion.
Applied theory paper: Introduction → Motivating Evidence → Model → Results → Extensions → Evidence Supporting Model Implications → Conclusion. This “theory sandwich” is typical: motivating evidence informs the model, and the model generates additional predictions (difficult to come up with without the model) that are then tested empirically.
In addition, in both oral and written forms, the pyramidal structure applies: bottom line up front, then details developing the argument, and finally background and supplemental information. In this way, you go from less to more. Notice that when we discussed both the short and long products, we already had this structure: bottom line up front (first state research question), details to develop the argument (answer), and then antecedents/contribution/roadmap are the background and context. This principle scales down to individual sections and even paragraphs: each paragraph should open with a topic sentence that previews its content. A useful exercise for the written products: take the first sentence of each paragraph in your introduction, read them in sequence, and check whether they read like a slightly longer abstract.
Tables and figures Tables and figures are great for conveying results. They should be self-contained: clear titles, labeled axes, explicit variable names, estimation methods noted, and footnotes providing enough details that a reader can understand the exhibit without consulting the main text. Many readers browse a paper by reading the abstract, then the introduction, then skimming the tables and figures. If those elements do not stand alone, you lose that reader.
Adapt tables and figures for different contexts. Tables in seminar slides should focus on the key variables. For figures, label curves directly rather than relying on external legends, and choose color-and-pattern combinations that remain legible in black and white.2
Theory Any model is a representation of reality with enough simplification to distill clear conclusions yet not so much that it becomes unrealistic or irrelevant. Therefore, you need a careful balance between simplicity and realism for your model. When you have a model, there will be many assumptions. Solow’s famous growth paper starts with “All theory depends on assumptions which are not quite true. That is what makes it a theory. The art of successful theorizing is to make the inevitable simplifying assumptions in such a way that the final results are not very sensitive. A ‘crucial’ assumption is one on which the conclusions do depend sensitively, and it is important that crucial assumptions be reasonably realistic.” Therefore, for every assumption, do two things: explain why it is there and what feature of reality it captures, and state whether it is made for analytical convenience or whether it is crucial for the results. If an assumption is crucial, provide evidence that it is realistic.
Conclusions Keep conclusions short, typically one page. This is where you Summarize key takeaways and limitations, but also somewhere to have the liberty to be more speculative than in the rest of the paper. You can discuss policy implications, suggest directions for future research, or sketch how the project could be extended. While speculation is acceptable here, it still should be grounded in your research. Krugman discussed in his 1980 AER paper that allowing factor mobility might produce agglomeration, an idea that became the foundation of the New Economic Geography eleven years later. Of course, your speculations in the conclusion do not need to go this far, but it is still a good place to say that the work is part of a broader agenda, or to preempt criticism by highlighting how you could have tackled things that might worry people, which you are not doing but would reasonably not go against your research.
Lastly, as an additional brief comment for producing research outputs. Nowadays, new tools such as artificial intelligence can assist with specific tasks, such as editing or improving clarity (and are super good for coding). A recommendable way of using AI for writing is to guide it carefully and use it to refine existing text, or when there is already a satisfying initial structure. Think of AI as a capable assistant that helps you think, code, and write more efficiently, not as a replacement for your own thinking and writing.
Policy-Oriented Research Products
Academic research products are not the only outputs an economist can produce. Policy-oriented research constitutes a parallel category with its own formats and constraints. Understanding these formats is valuable even at the PhD stage. Policymakers may seek research evidence to inform decisions, to justify actions already taken, or to improve implementation. There are roughly three types of policy-related research outputs:
Policy Evaluation: Academic journals prioritise novelty, but policy-oriented research often requires answering a question for a concrete measure important for the decision. For instance, evaluating a transport program, a labor-market reform, or a tax change for a particular setting is a genuine input into the decision process. Therefore, even if they probably will not yield a top-journal publication, these papers are still valuable products.
Advisory Input: Policymakers sometimes seek insights from researchers to inform decisions they have not yet made. This is probably going to happen later on in your career, such as taking the role of an Economic Advisor. For this, policymakers would want to talk to you and obtain information that you know about because you are a researcher. Therefore, producing this format of output involves identifying research informative for their decisions, and translating academic findings into accessible and actionable knowledge.
Policy Justification: When policymakers have already decided on doing something, they will want to seek some justification and hope that you can provide some research to support it. This is more common than one might expect, but it varies greatly across countries.
The boundary between academic and policy research is evolving. As data-driven analysis and more sophisticated exercises become more common within governments, the demand for economists who can do rigorous research in policy settings is growing3. This means that policies are much better grounded in solid research, but it also has implications for your job-seeking process. For PhD students, the skills you develop, such as careful identification, transparent analysis, and clear communication, have value well beyond the walls of academia, but it also requires greater flexibility and adaptability of these skills in the policy domain.
Notes
The following suggestions complement those in the Opening Lecture and Lecture 1 on generating ideas.↩︎
Lecture 3 provides a comprehensive treatment of data visualization and the visualization of econometric results.↩︎
In Spain, for example, institutions such as AIReF and the Bank of Spain regularly recruit trained economists. Every ministry now has a scientific advisor serving as an interface between the academic community and the minister, and a recent open call invites researchers to work embedded within ministries for six to eight months on specific policy questions.↩︎