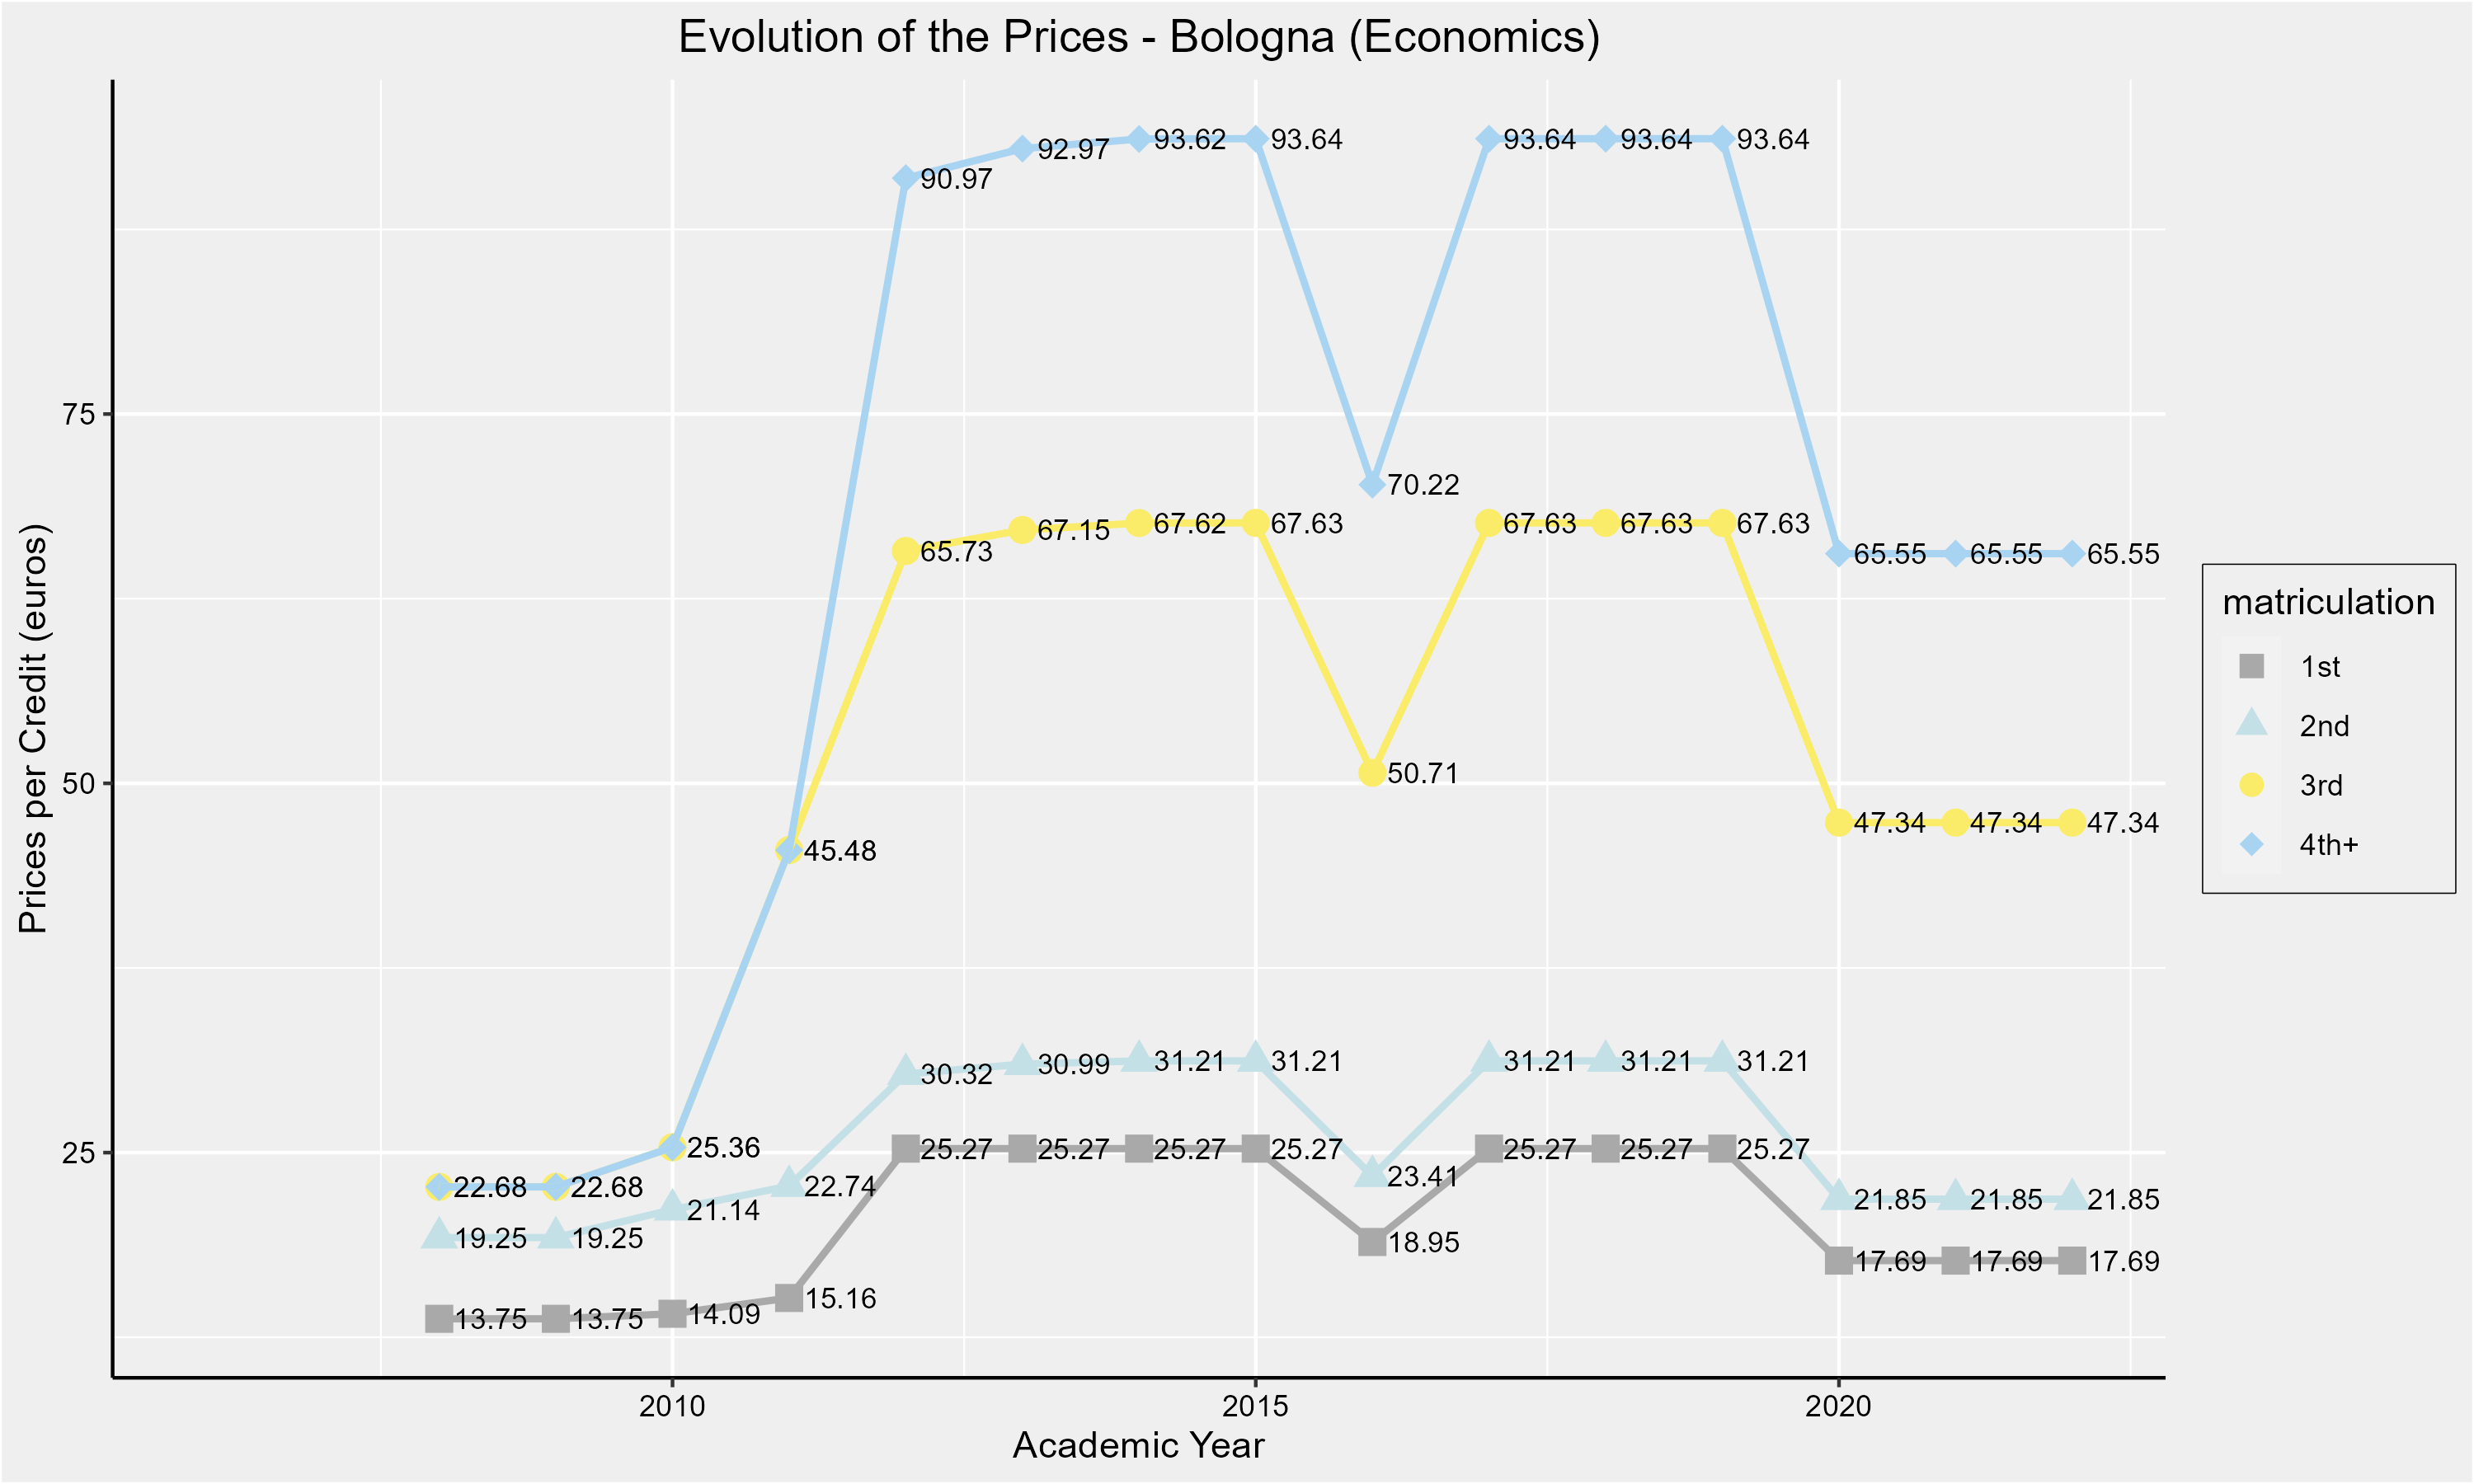
Exploratory Analysis: Retake Policy Project


Press O for an overview of this presentation.

Press → to see the contents.

1. Passing rates

passing rates
2. Absence ratio (first exam attempt)

absence ratio
1. Average Time to Pass (including people who did not pass)

Average Time to Pass (conditional on graduation)

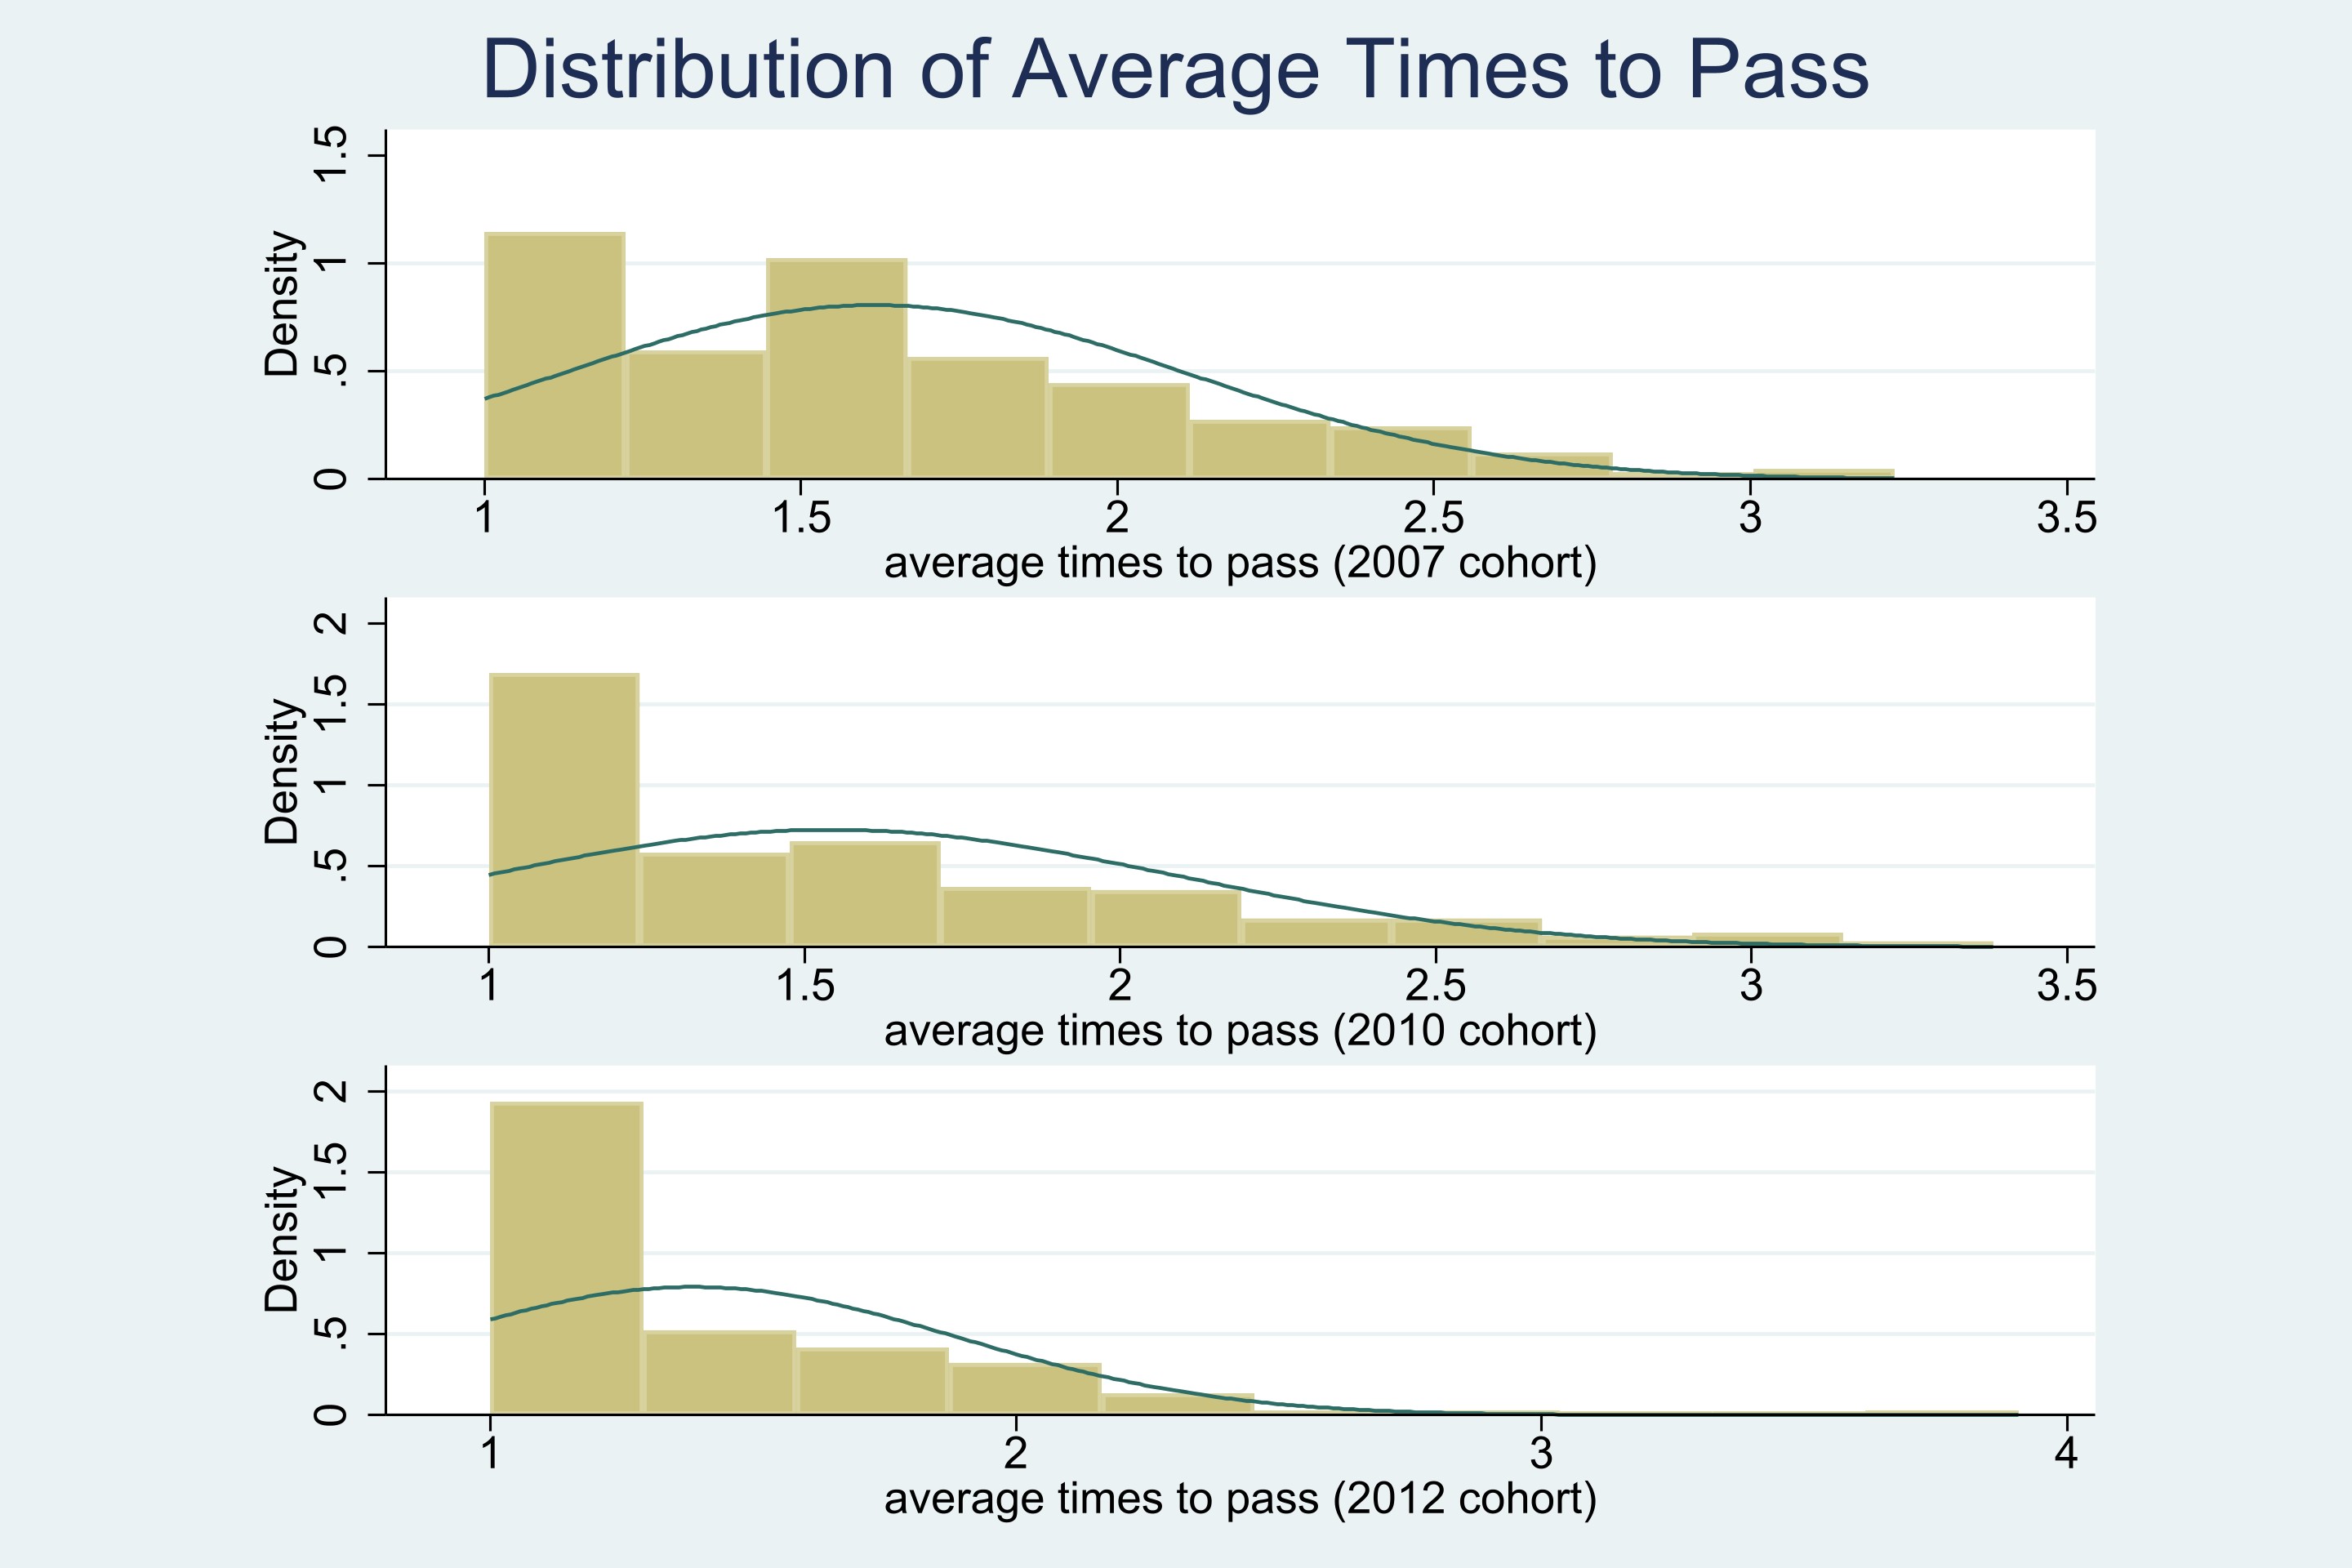
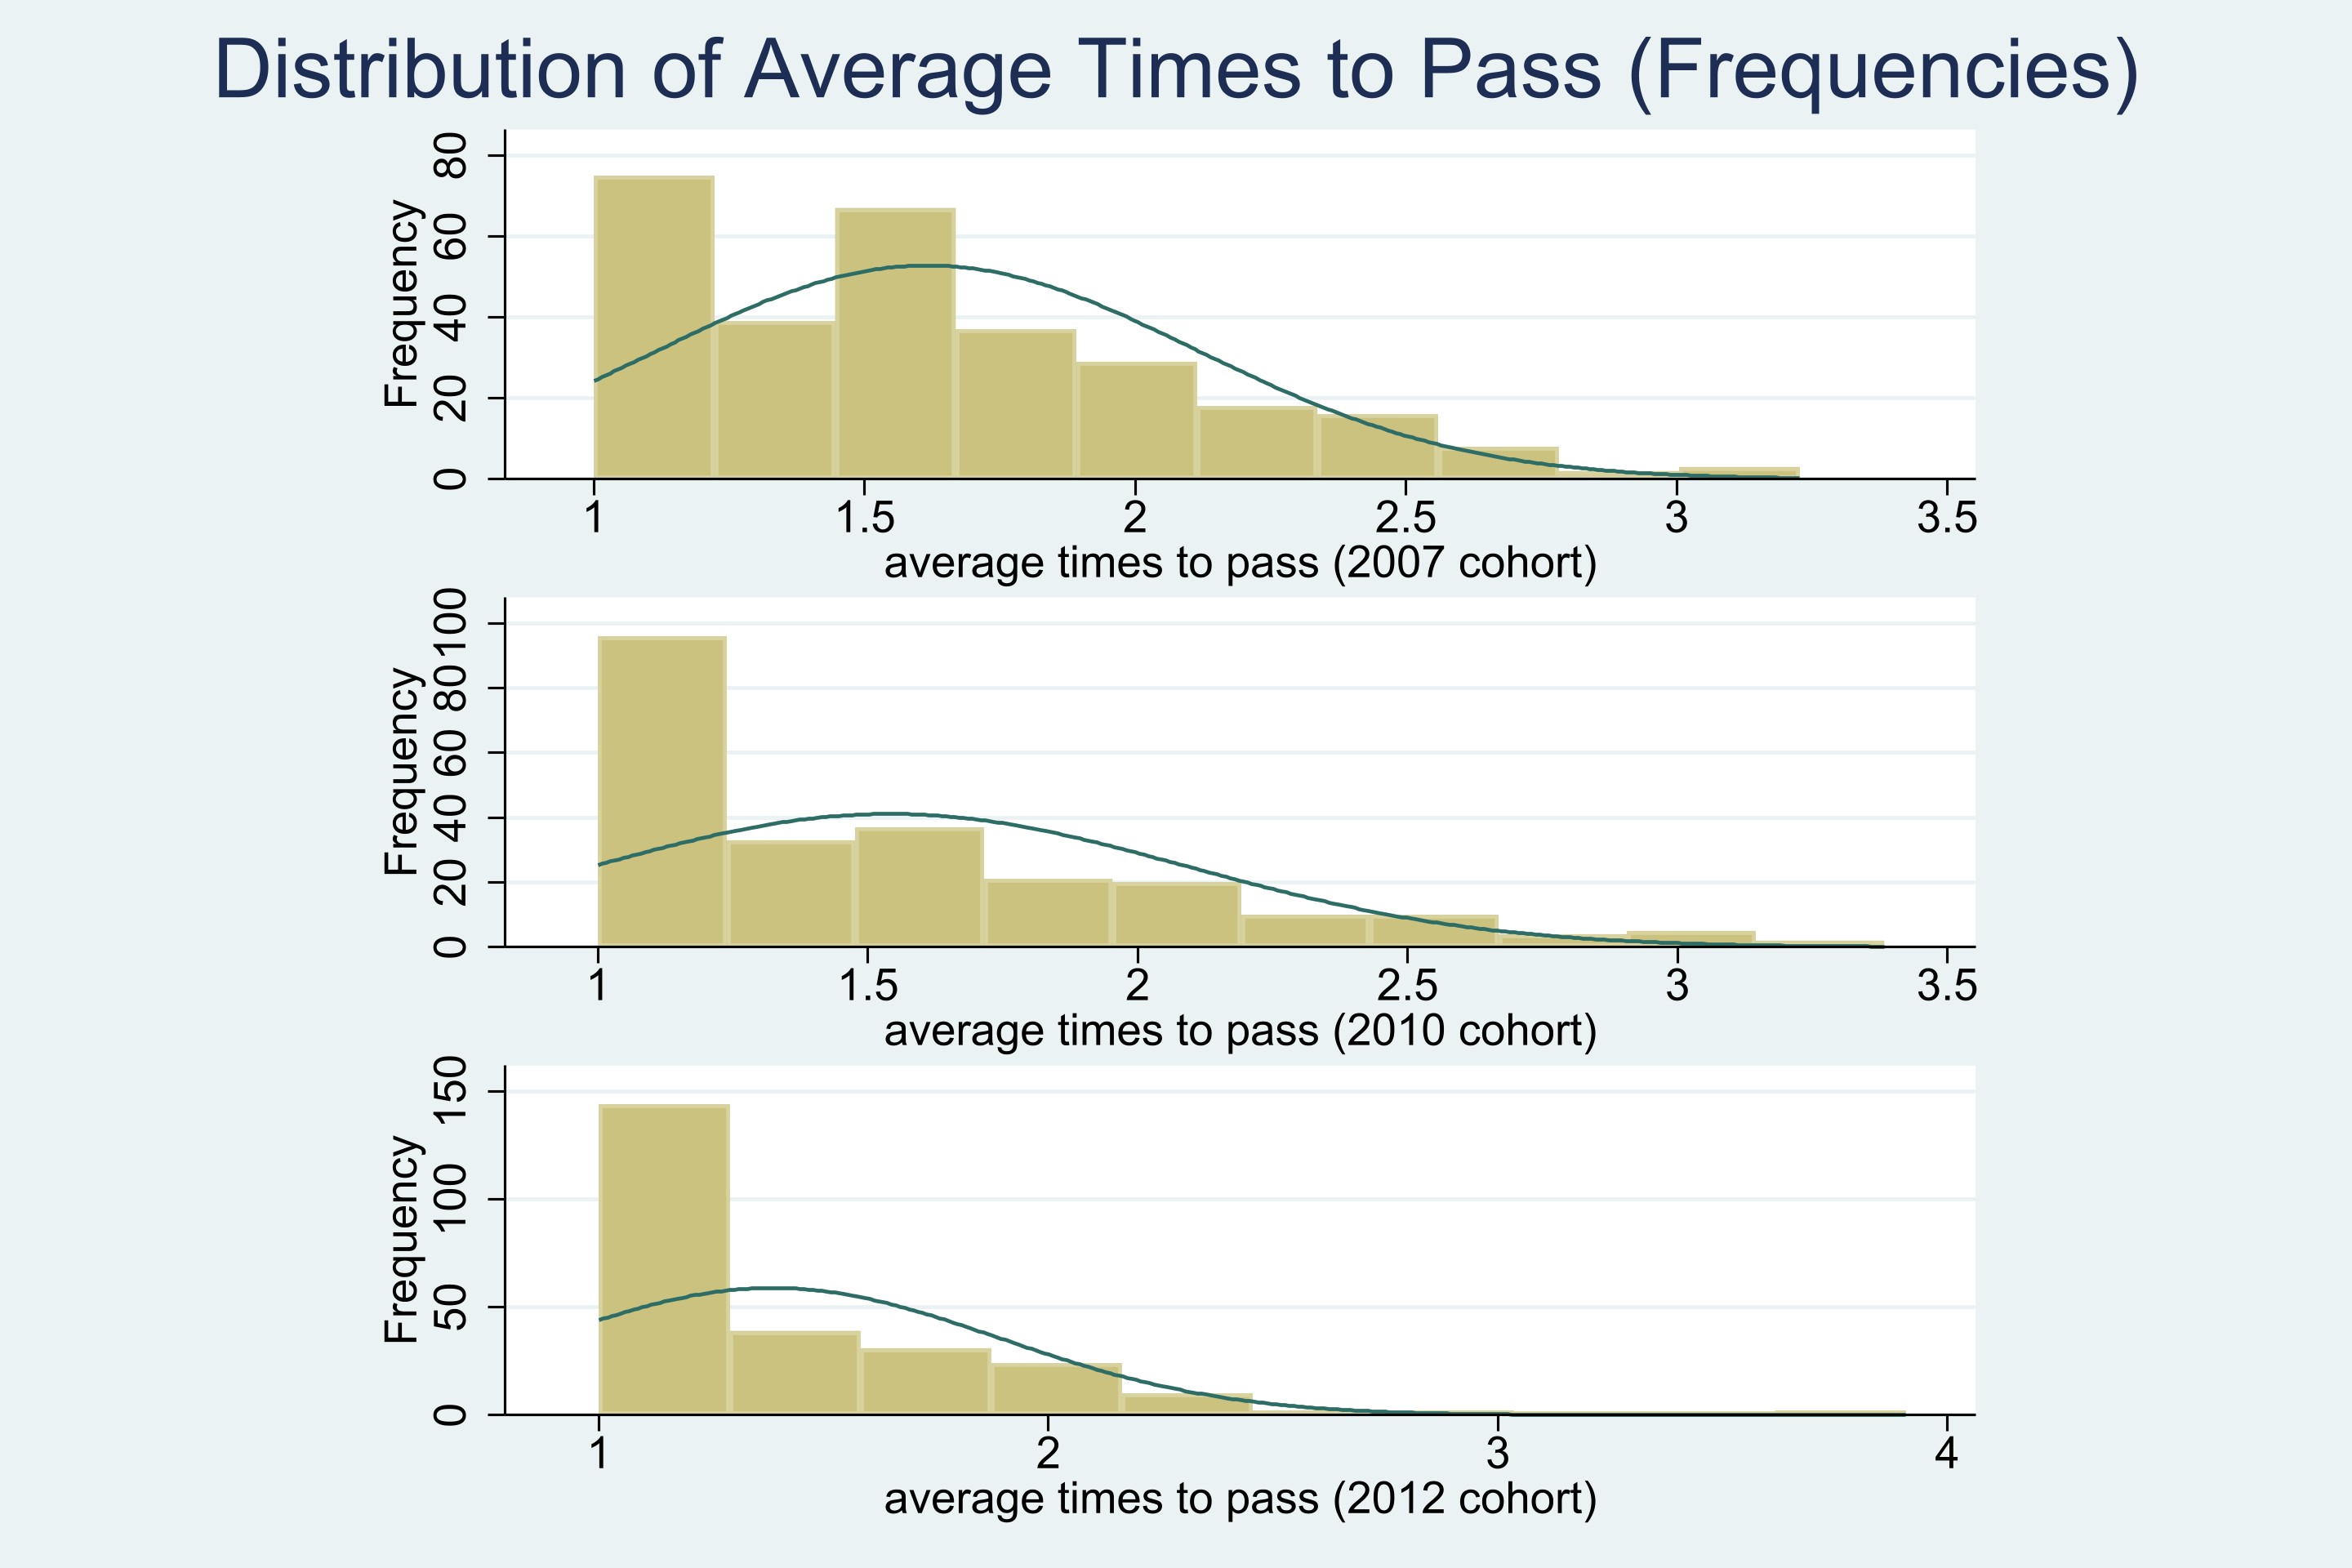
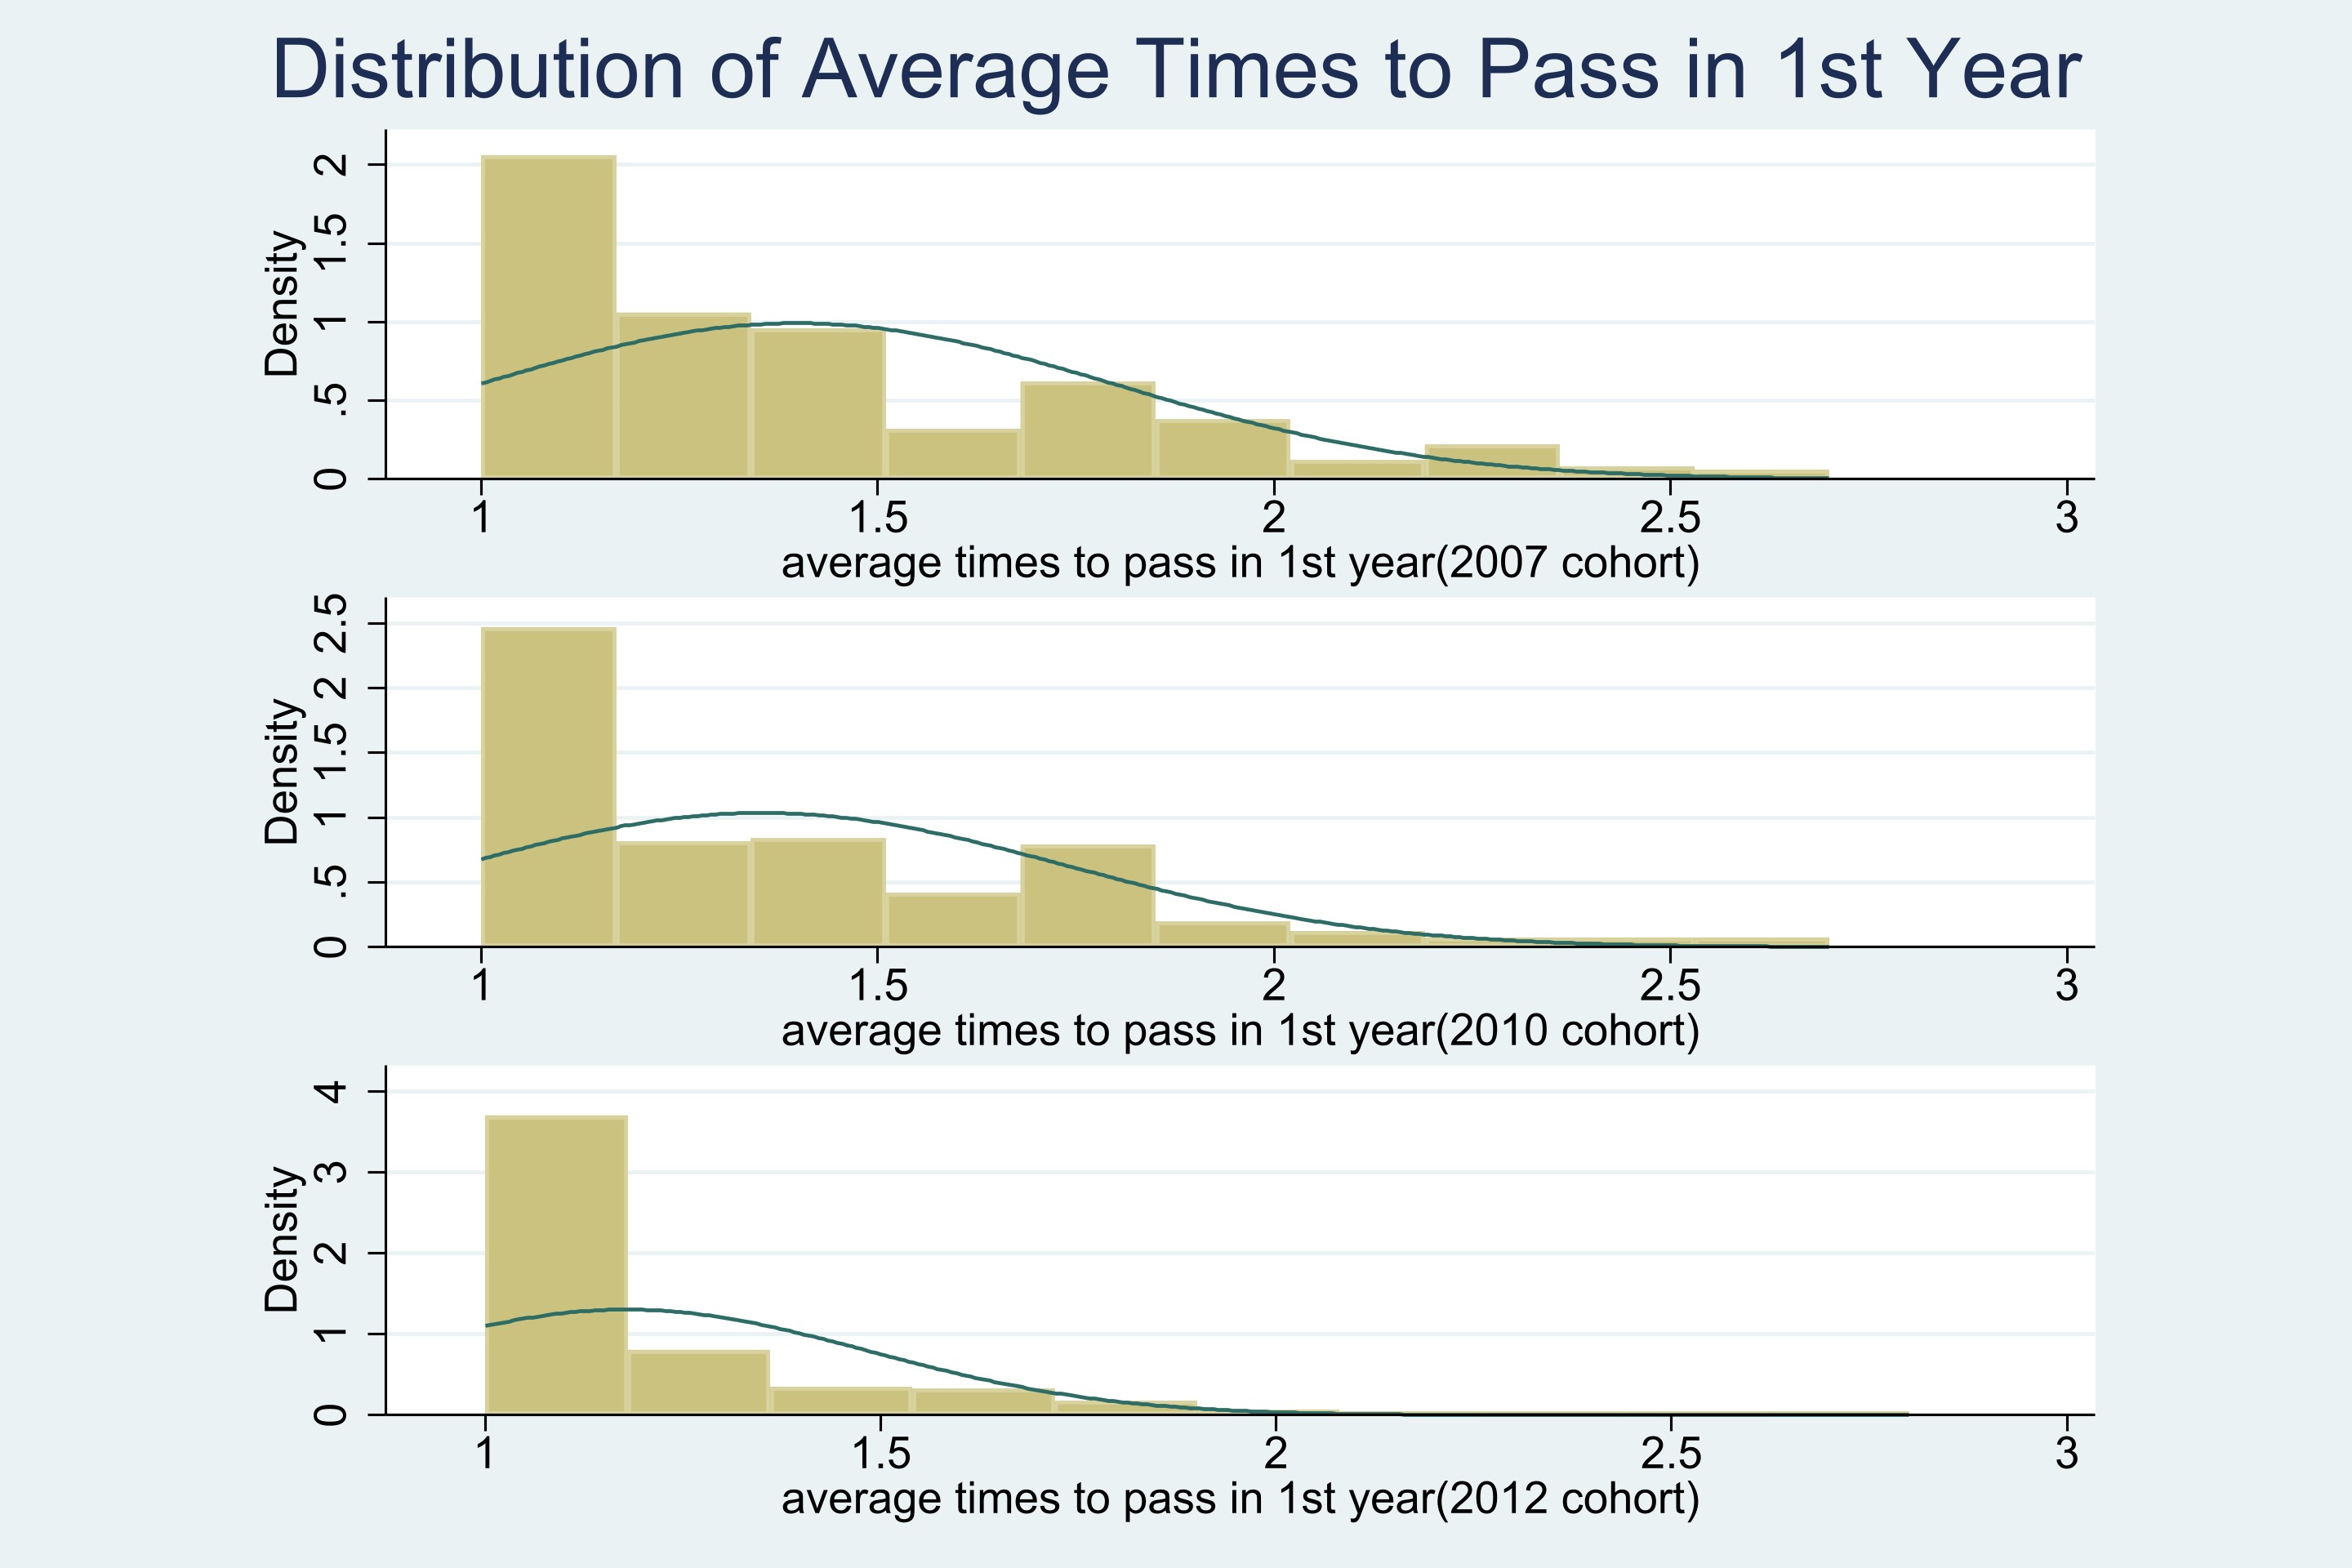
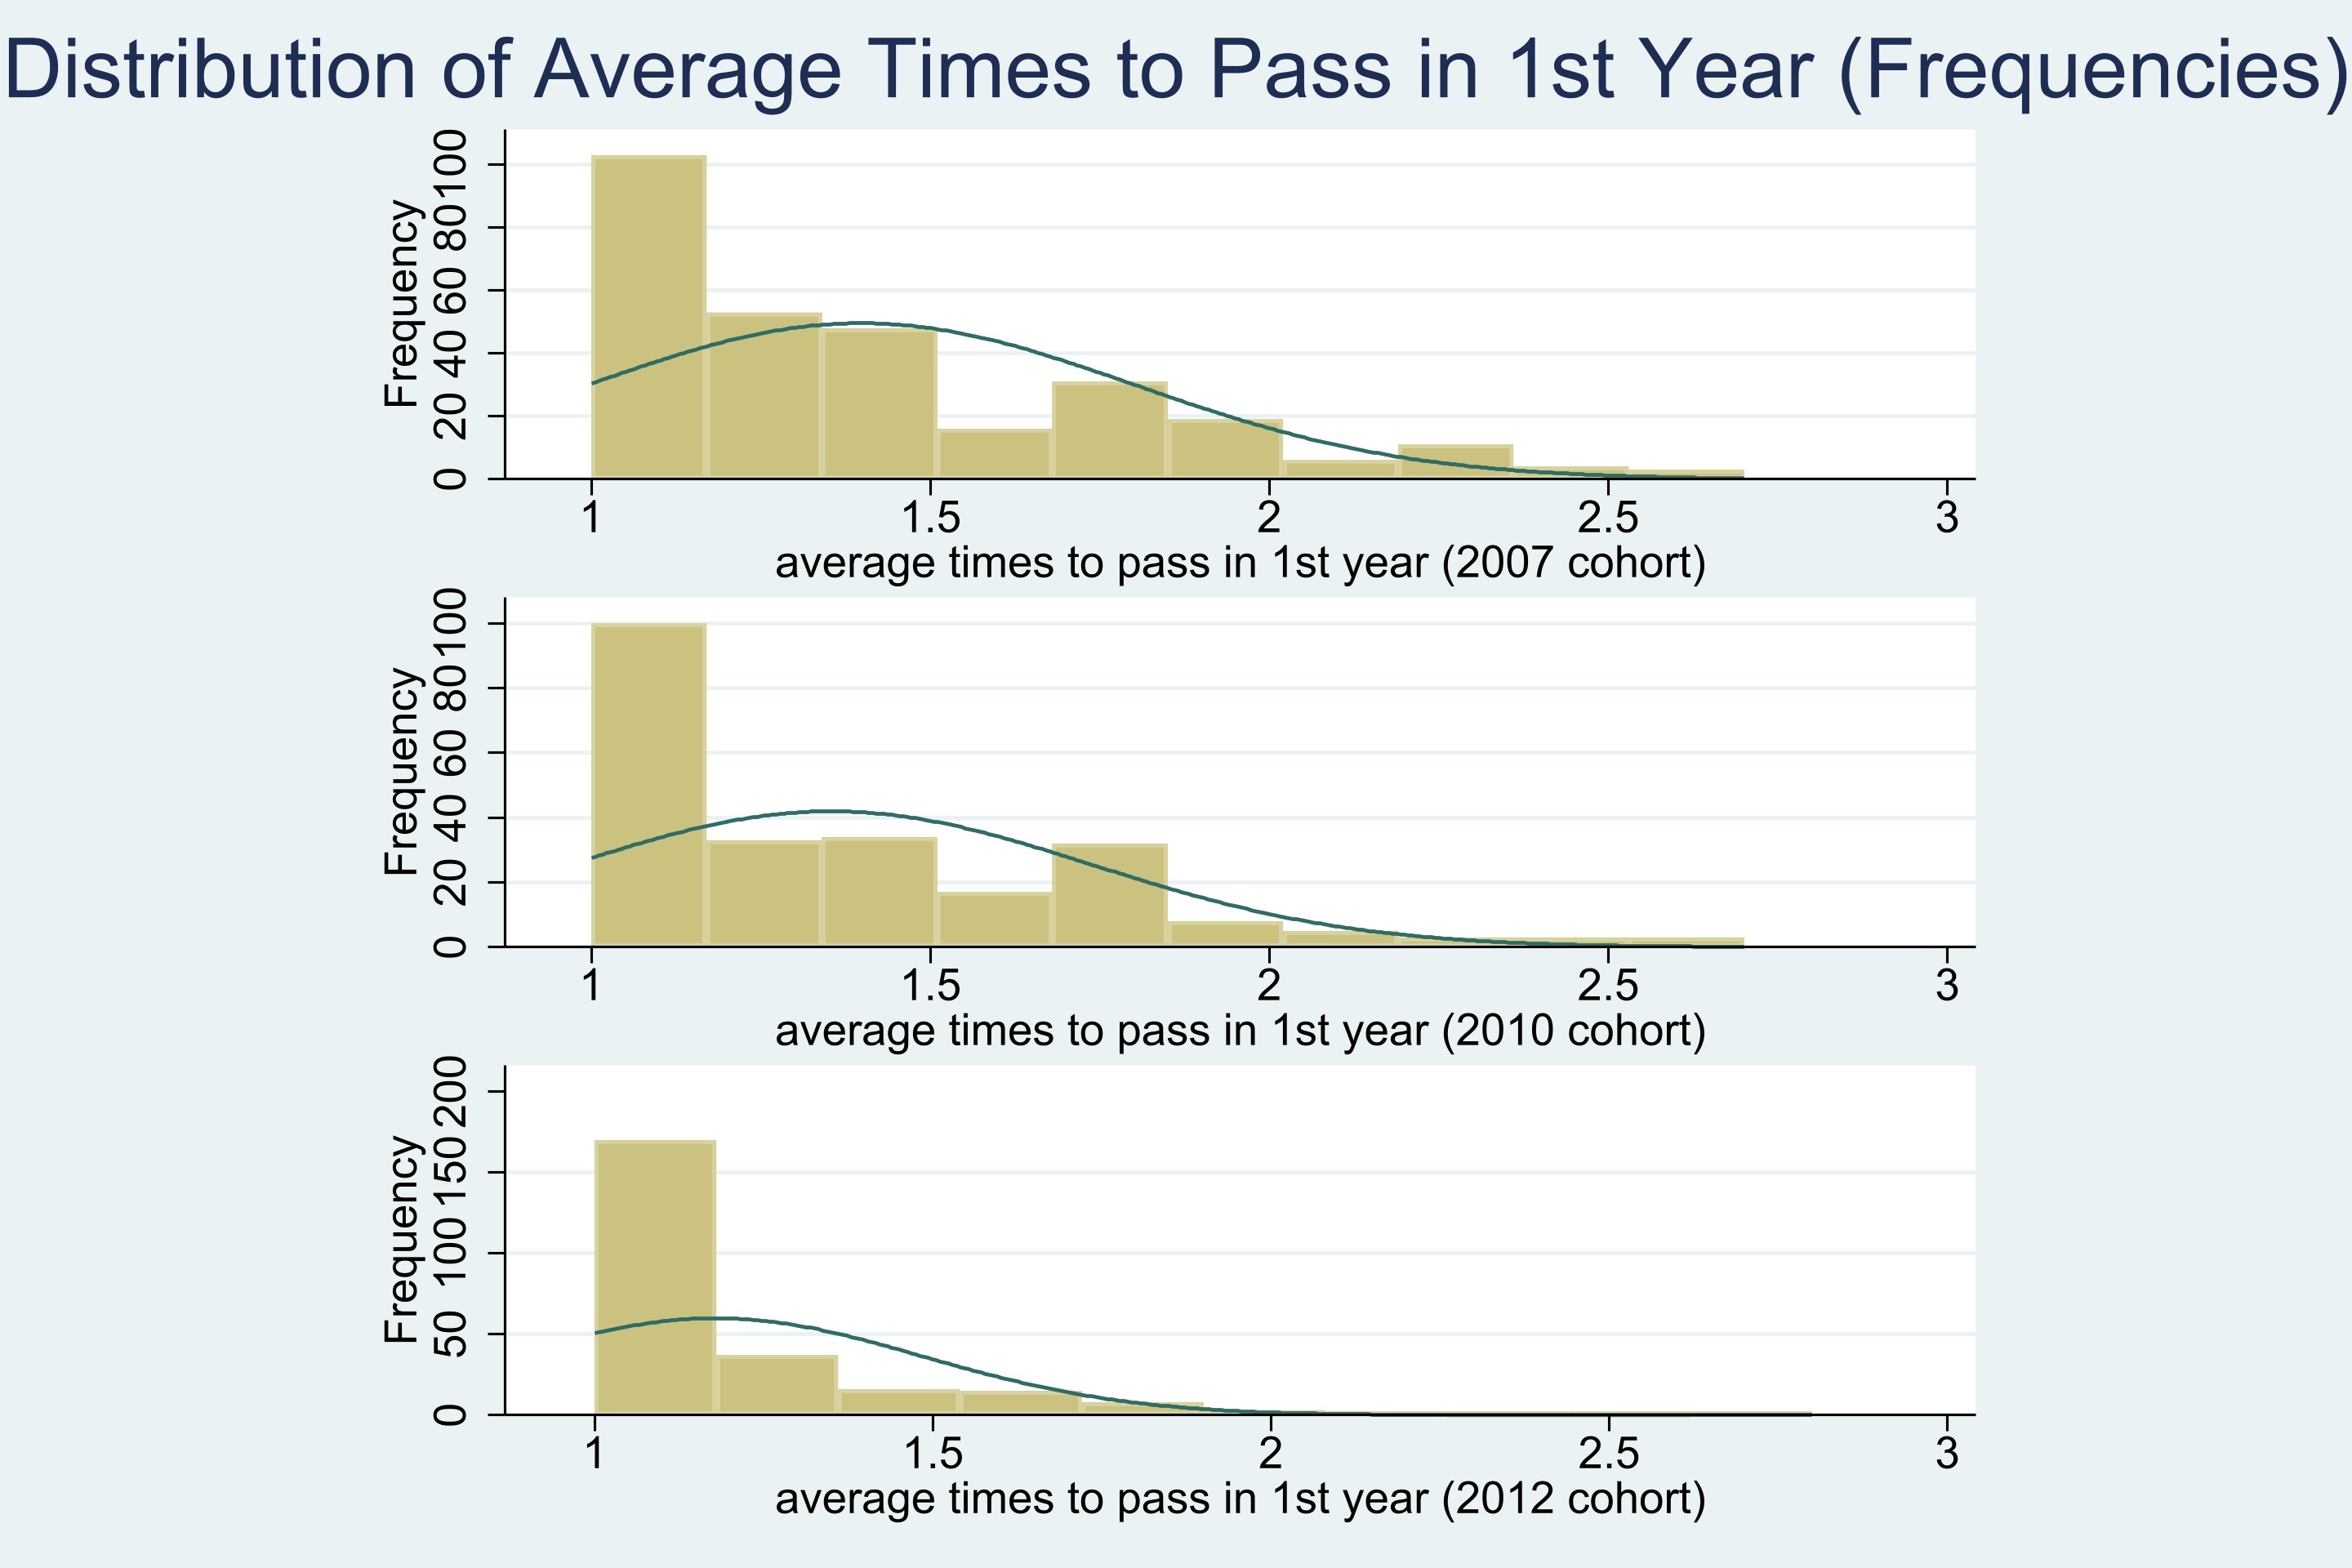
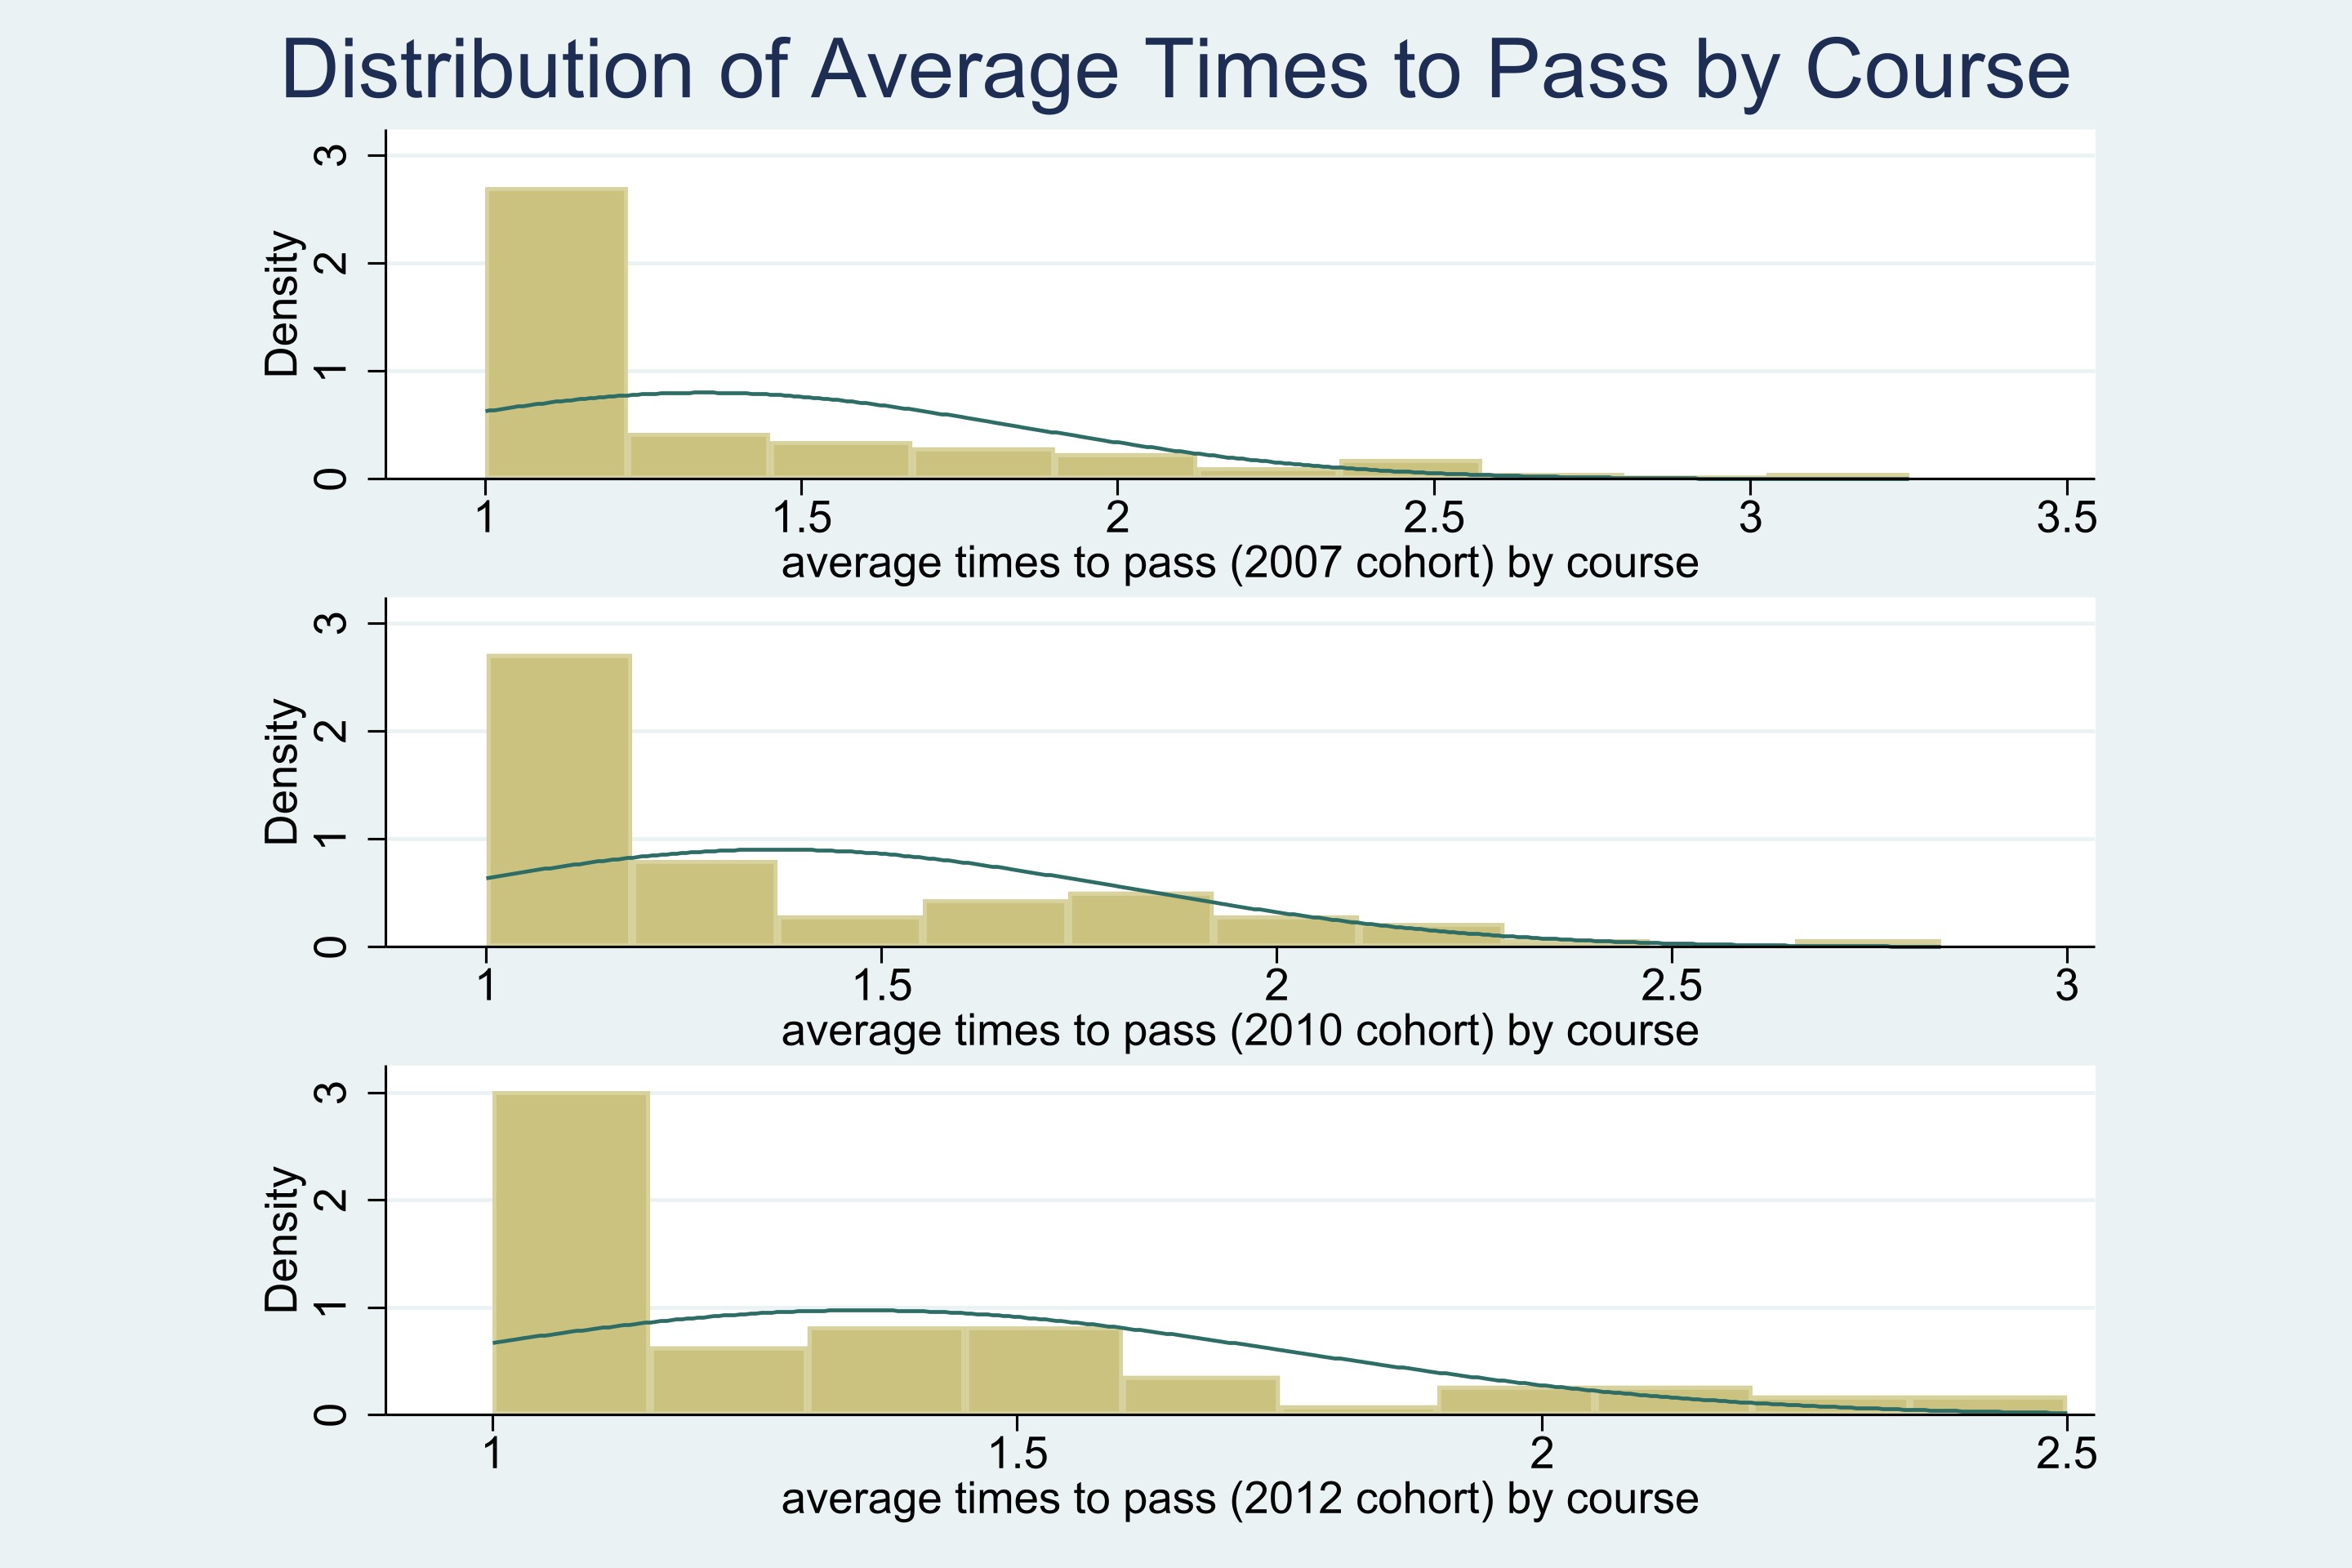
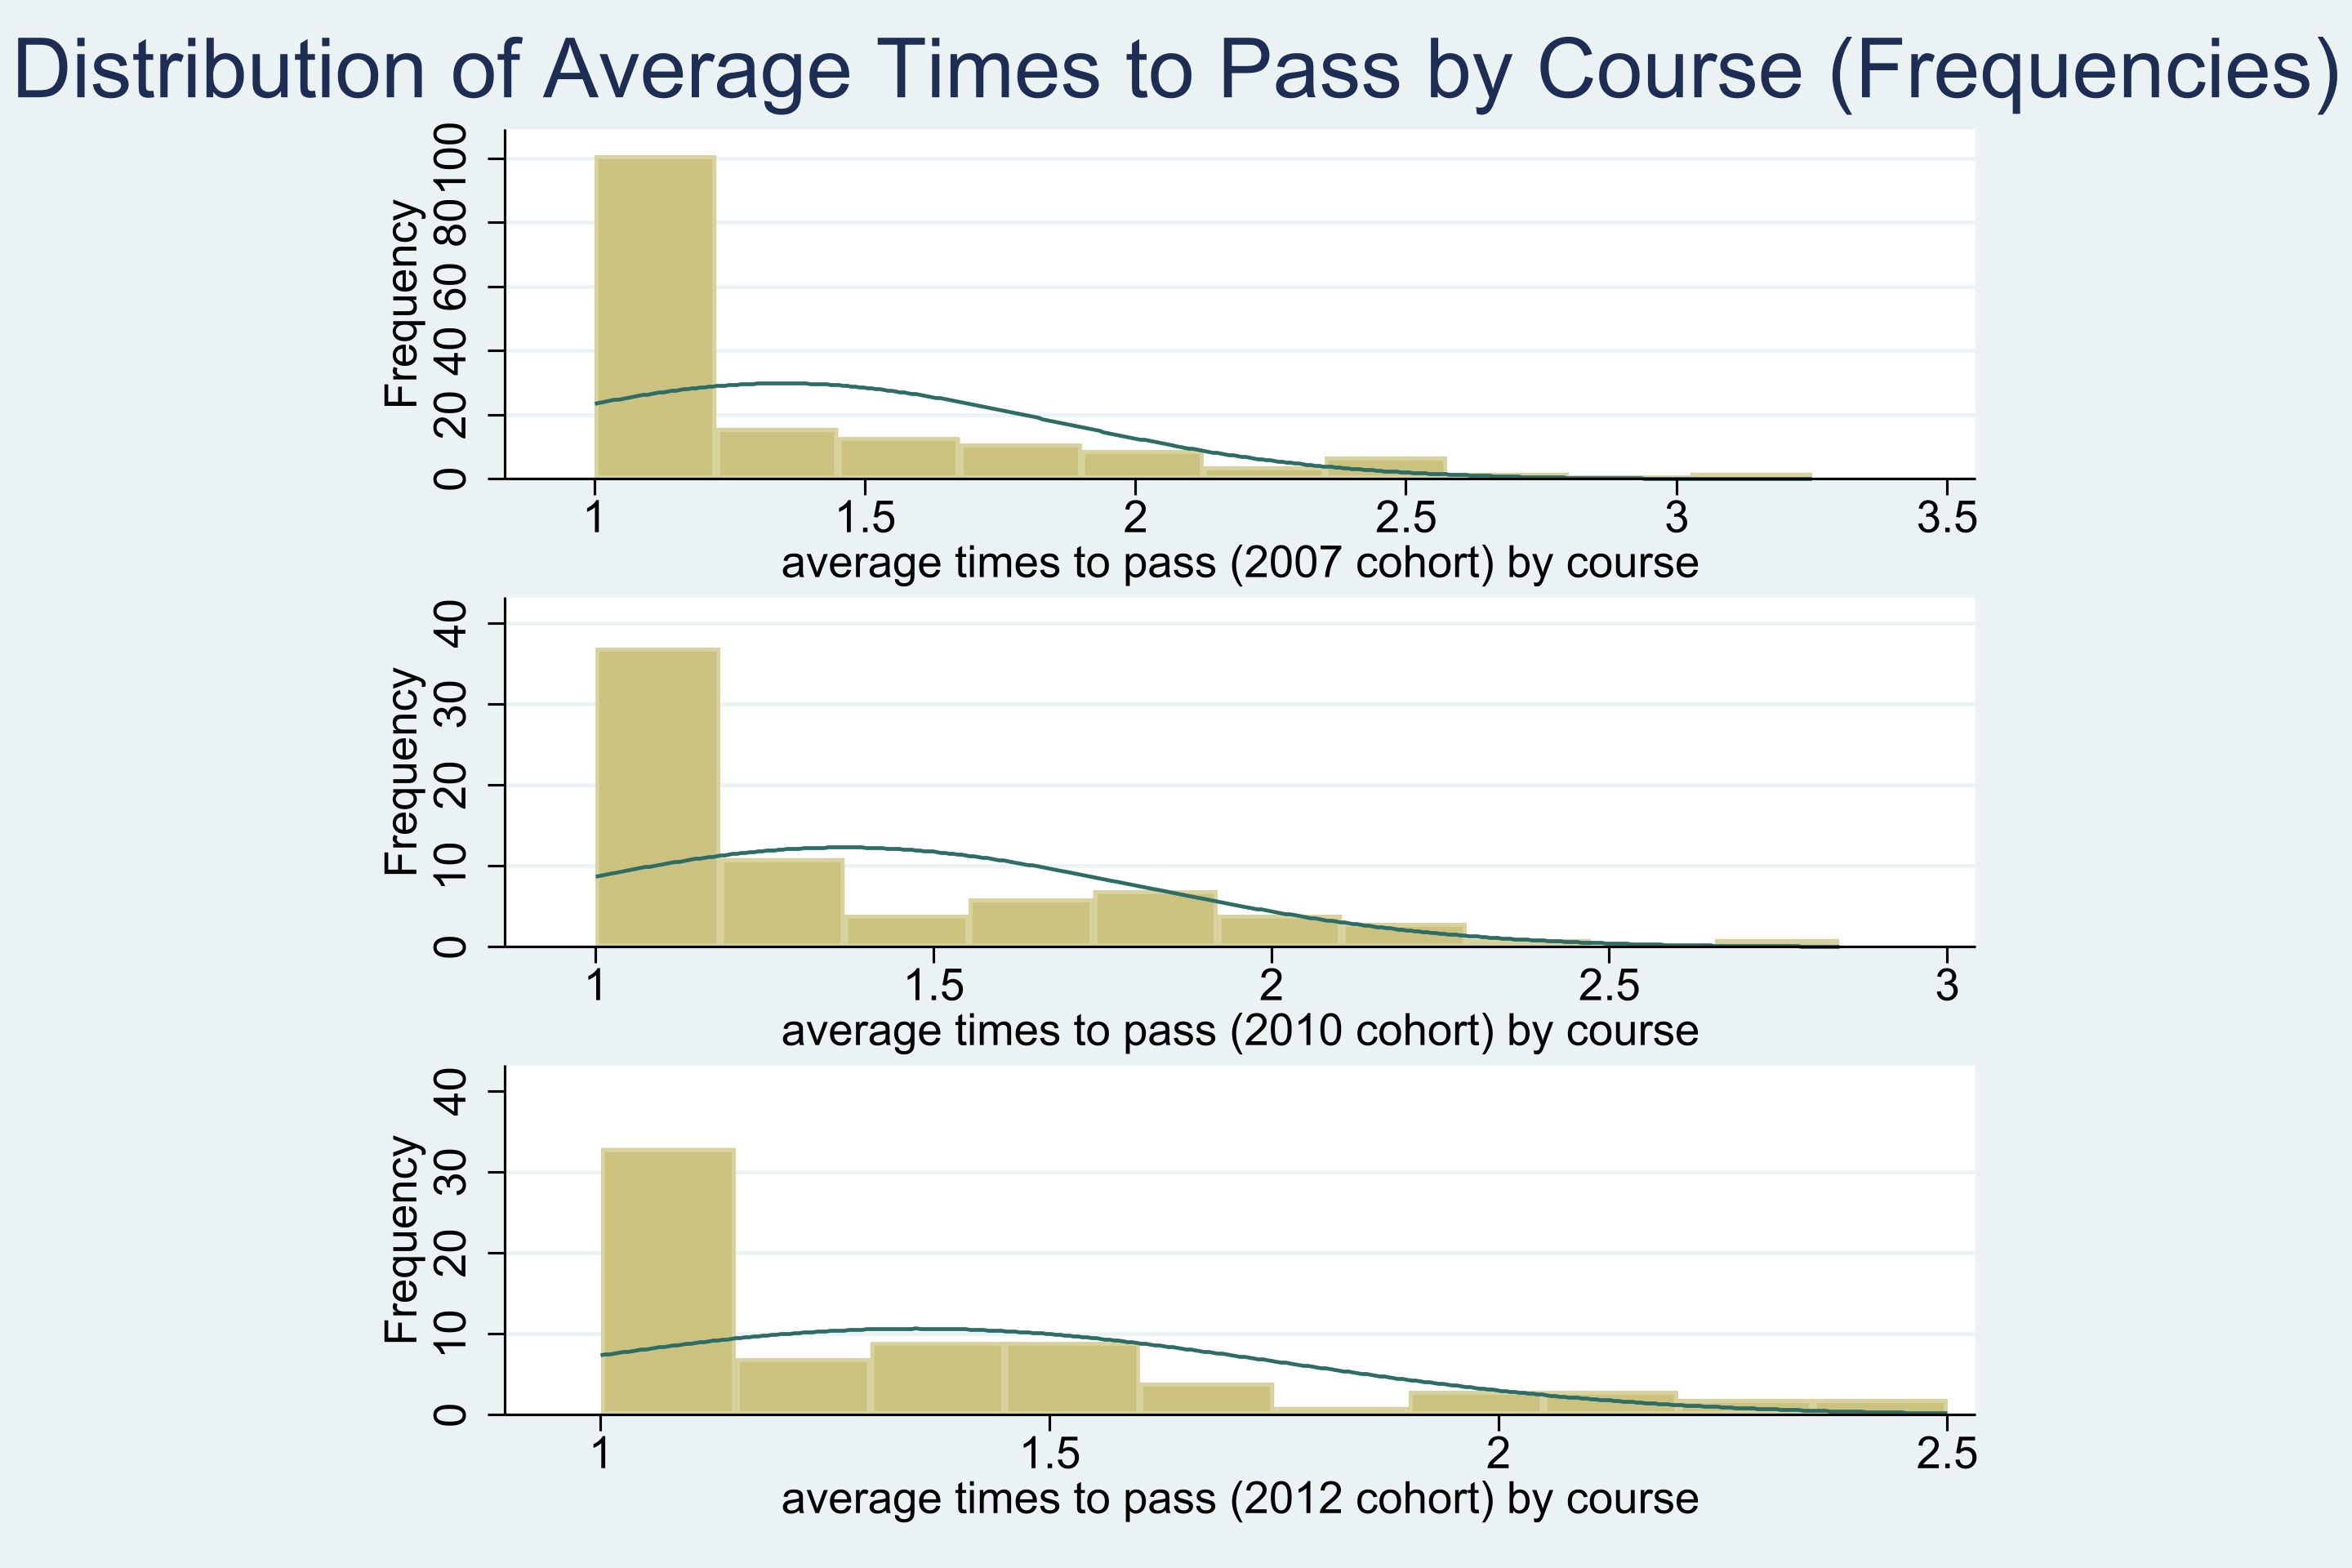
Note: density on the left and frequency on the right, same below.


Press ↓ to see following graphs.

2. Average Time to Pass by Gender

Average Time to Pass by Gender
3. Average Time to Pass (First Years)

Average Time to Pass (First Years)
4. Number of Courses Enrolled per Student

Number of Courses Enrolled

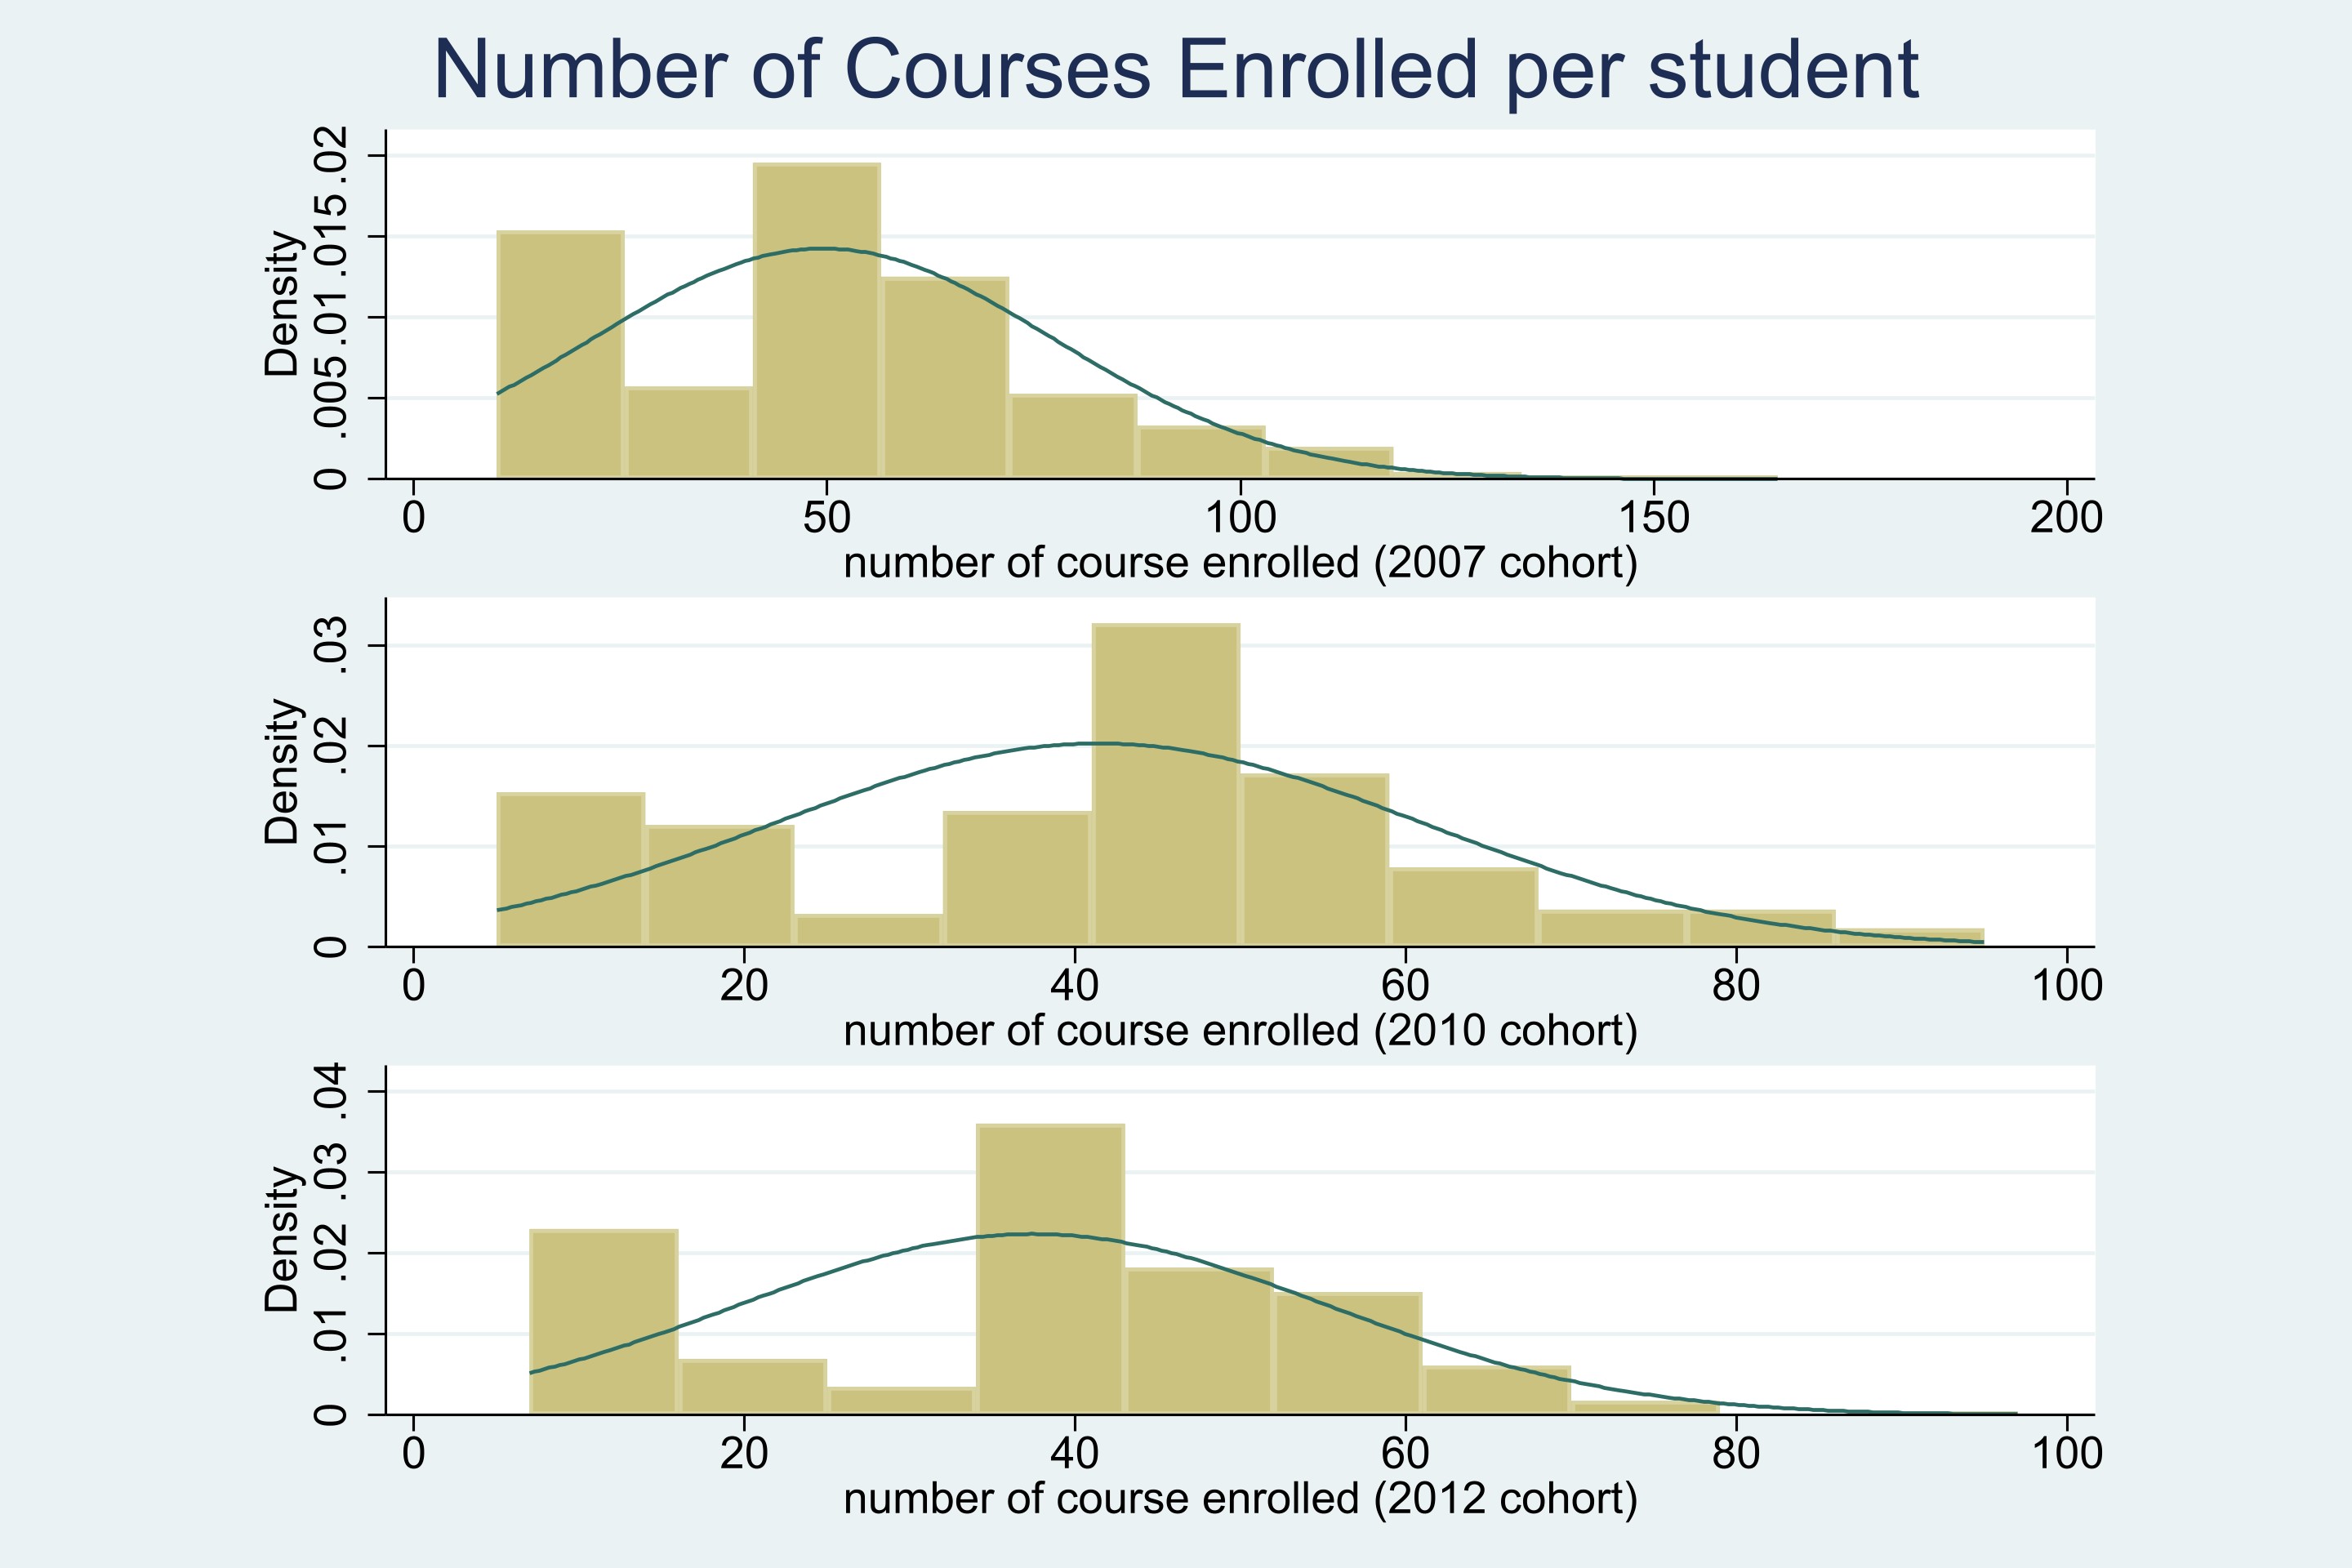
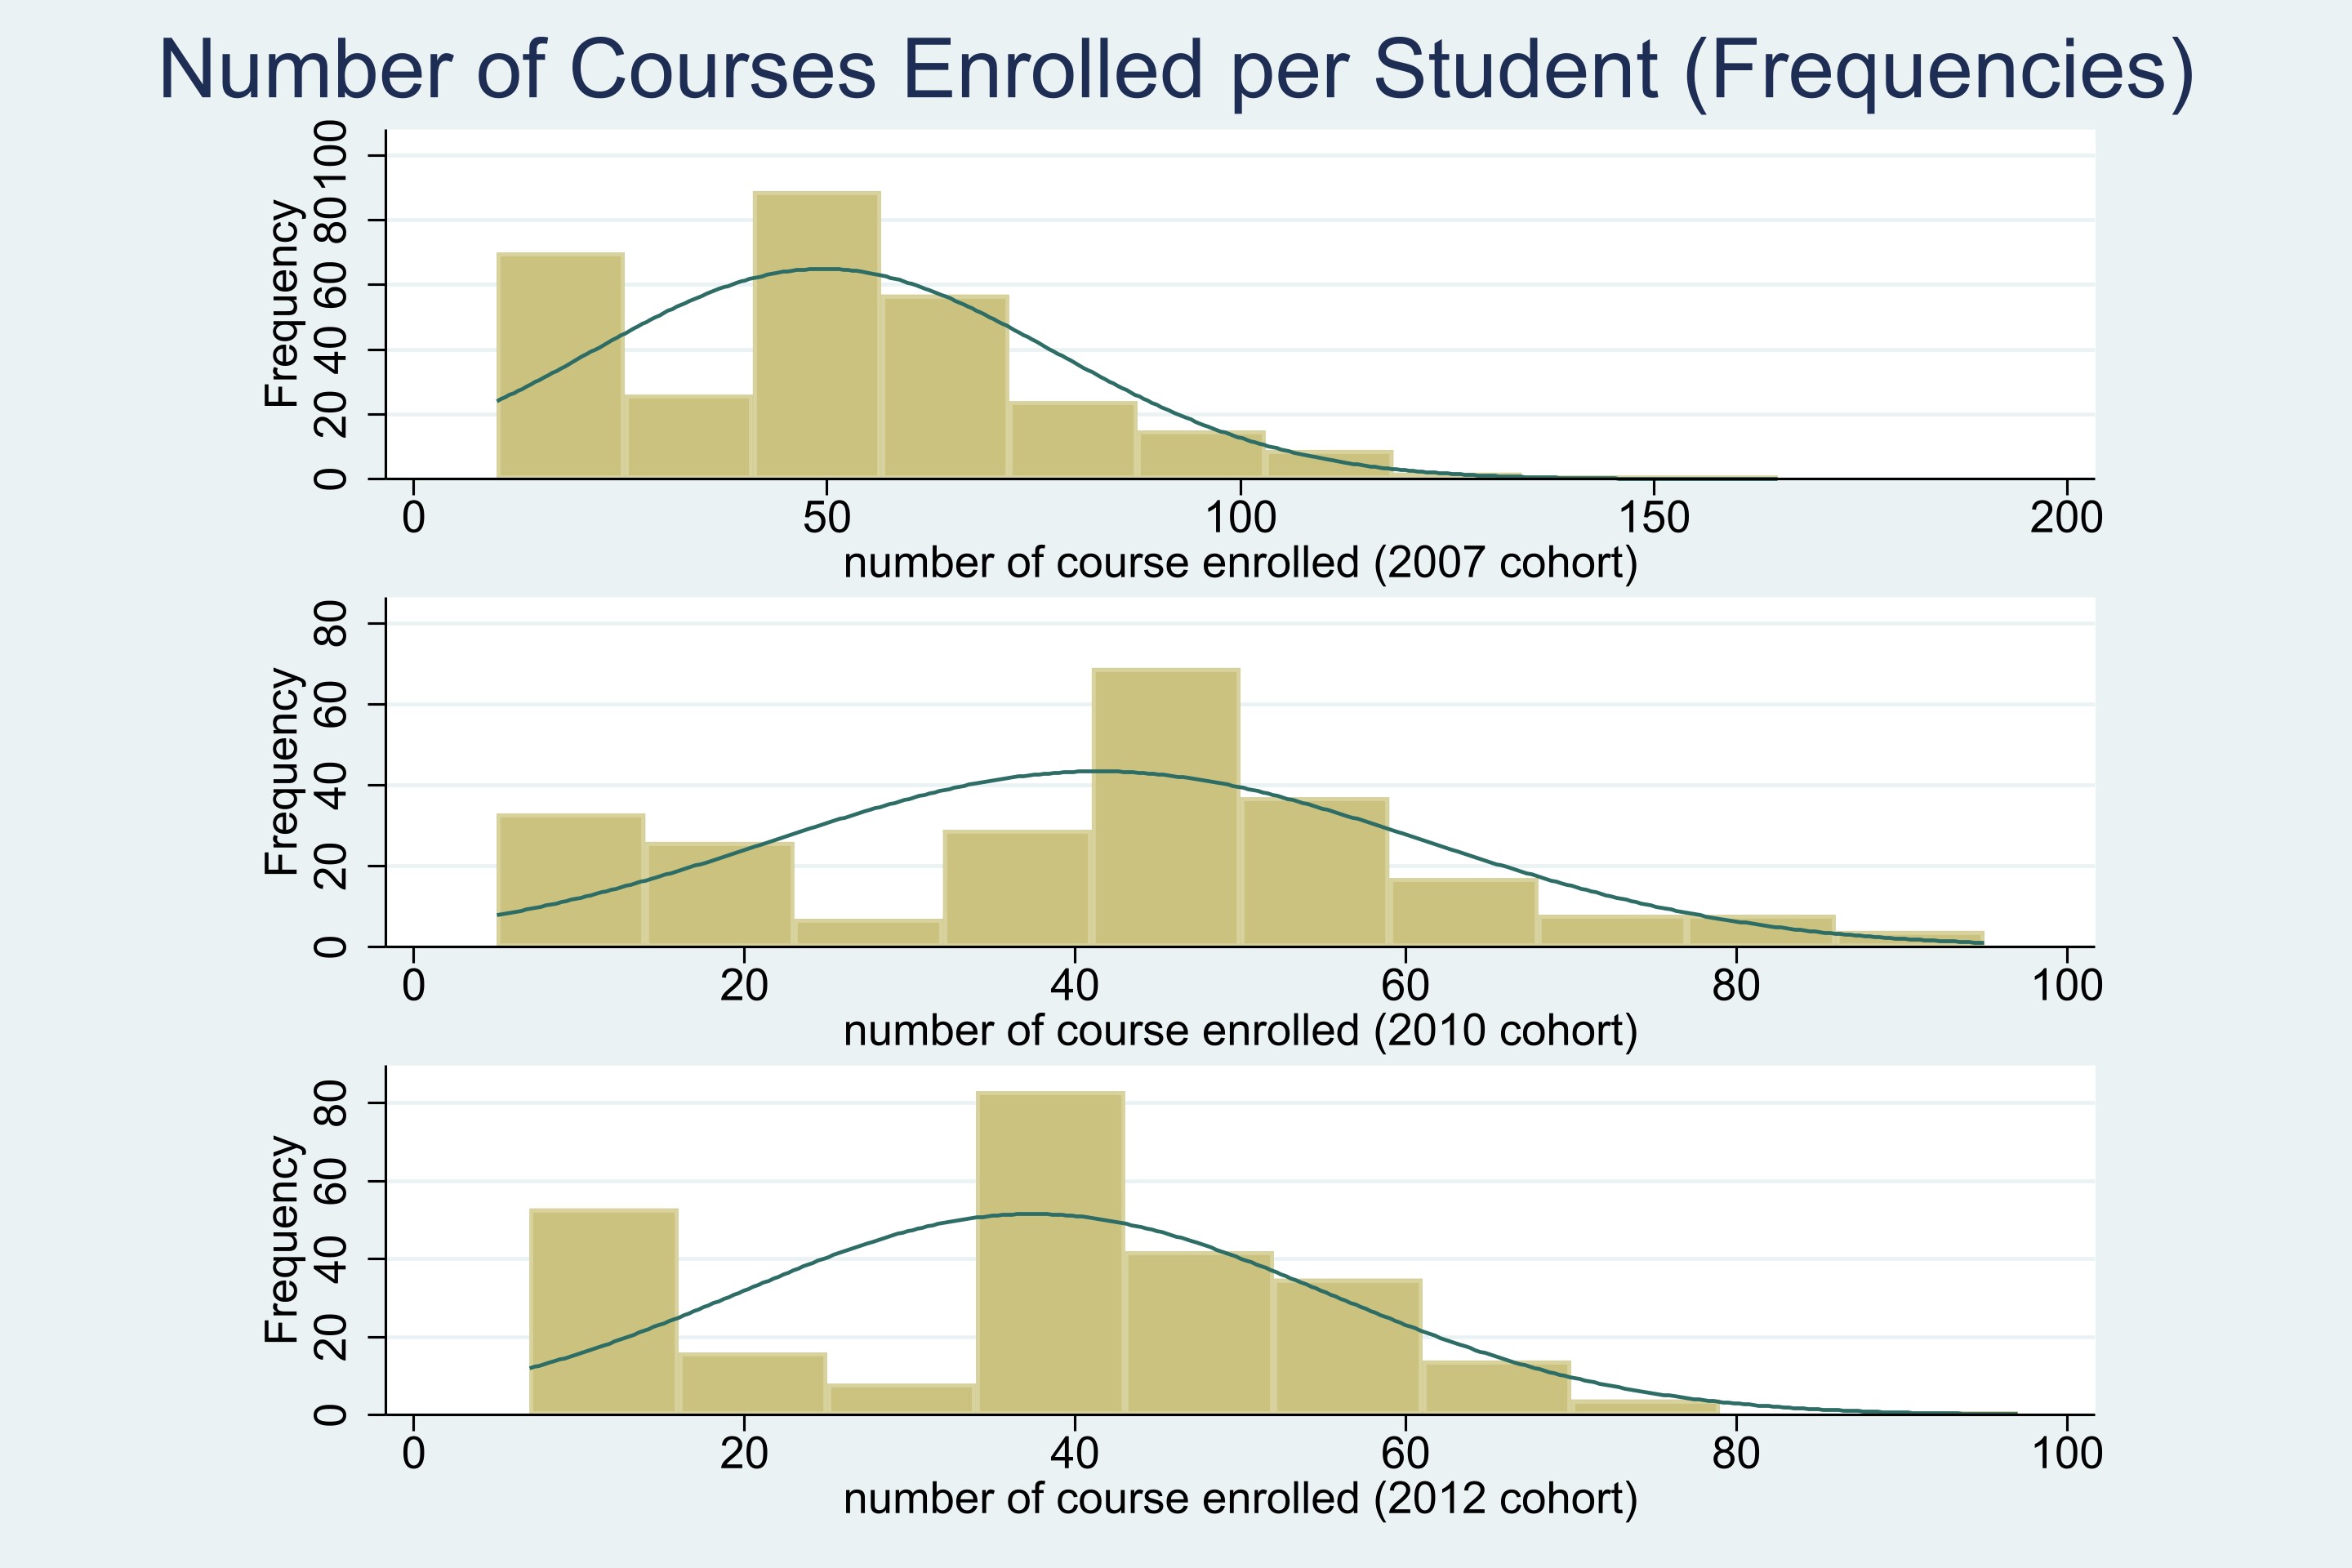
Question: the number of courses on the cirriculum changed before and after 2012?

4-1 Number of Courses Enrolled per Student (Excluding Recognitions).

Number of Courses Enrolled per Student
 Number of Courses Enrolled per Student

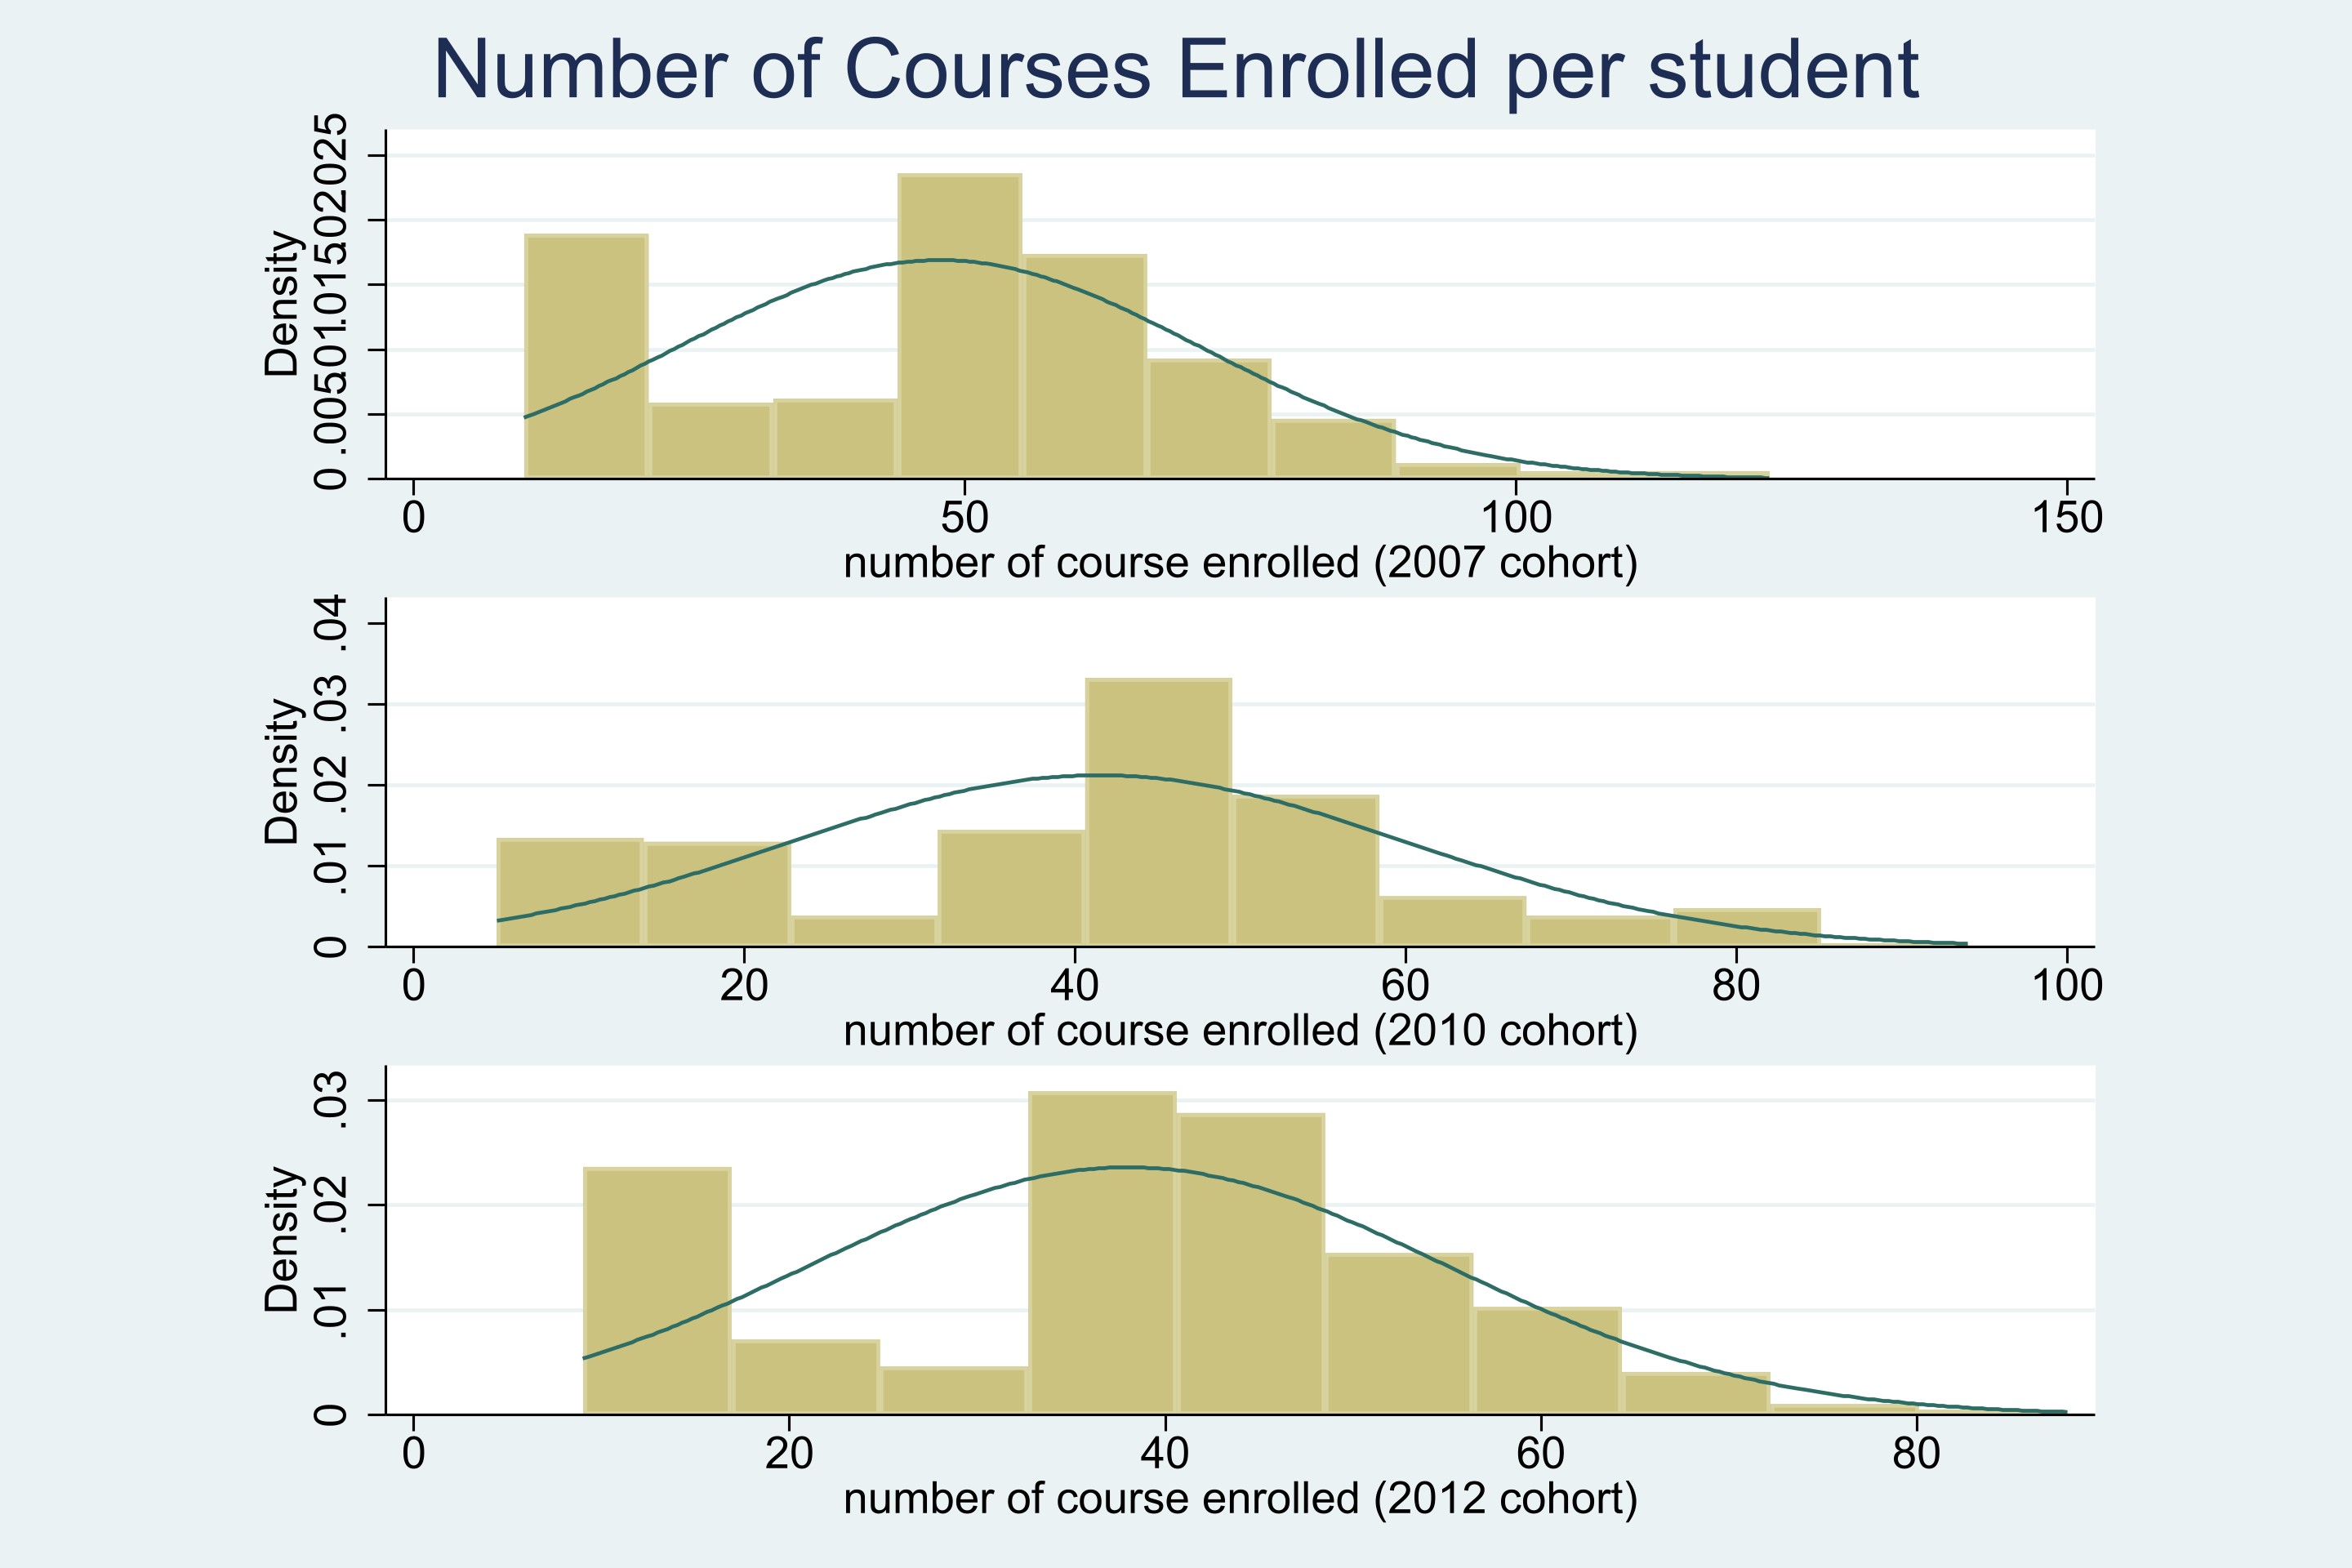
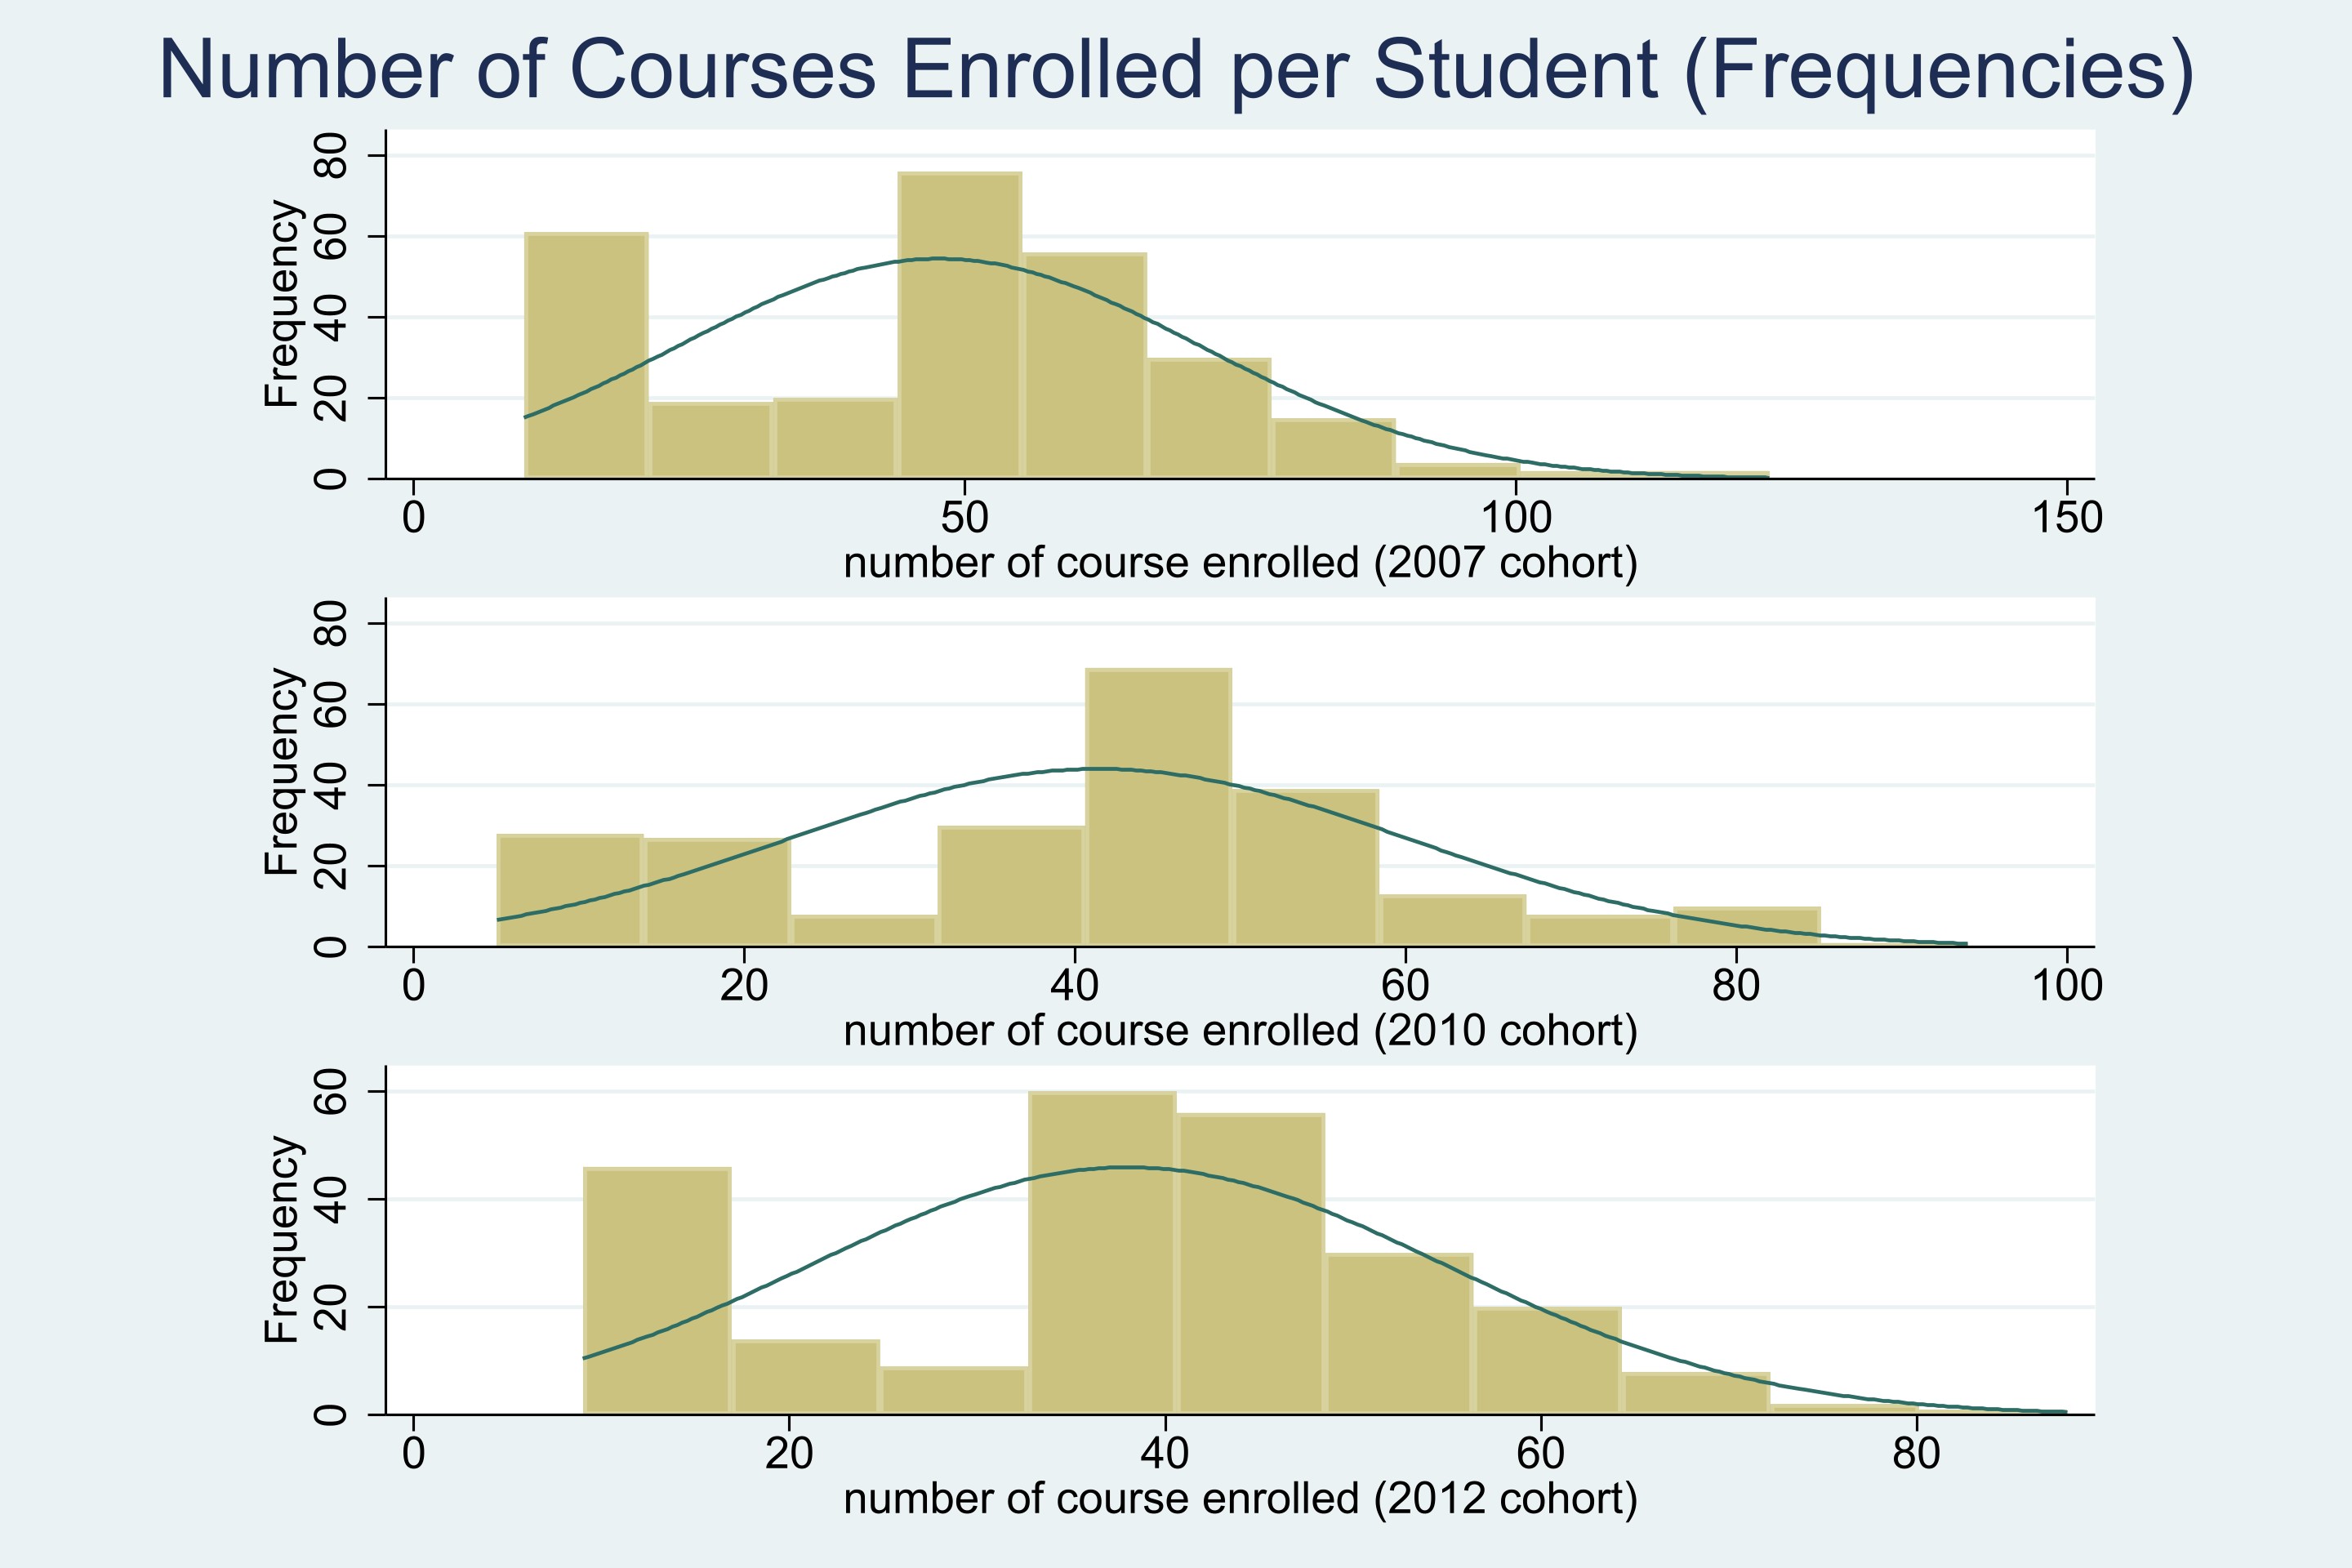
Note: Here I exclude records for the courses "taken" through credit recognition and the like, keeping only those taken in a normal sense (TIAPUN=="O" ).

4-2 Percentage of Good Grades per Student.

Percentage of Good Grades per student

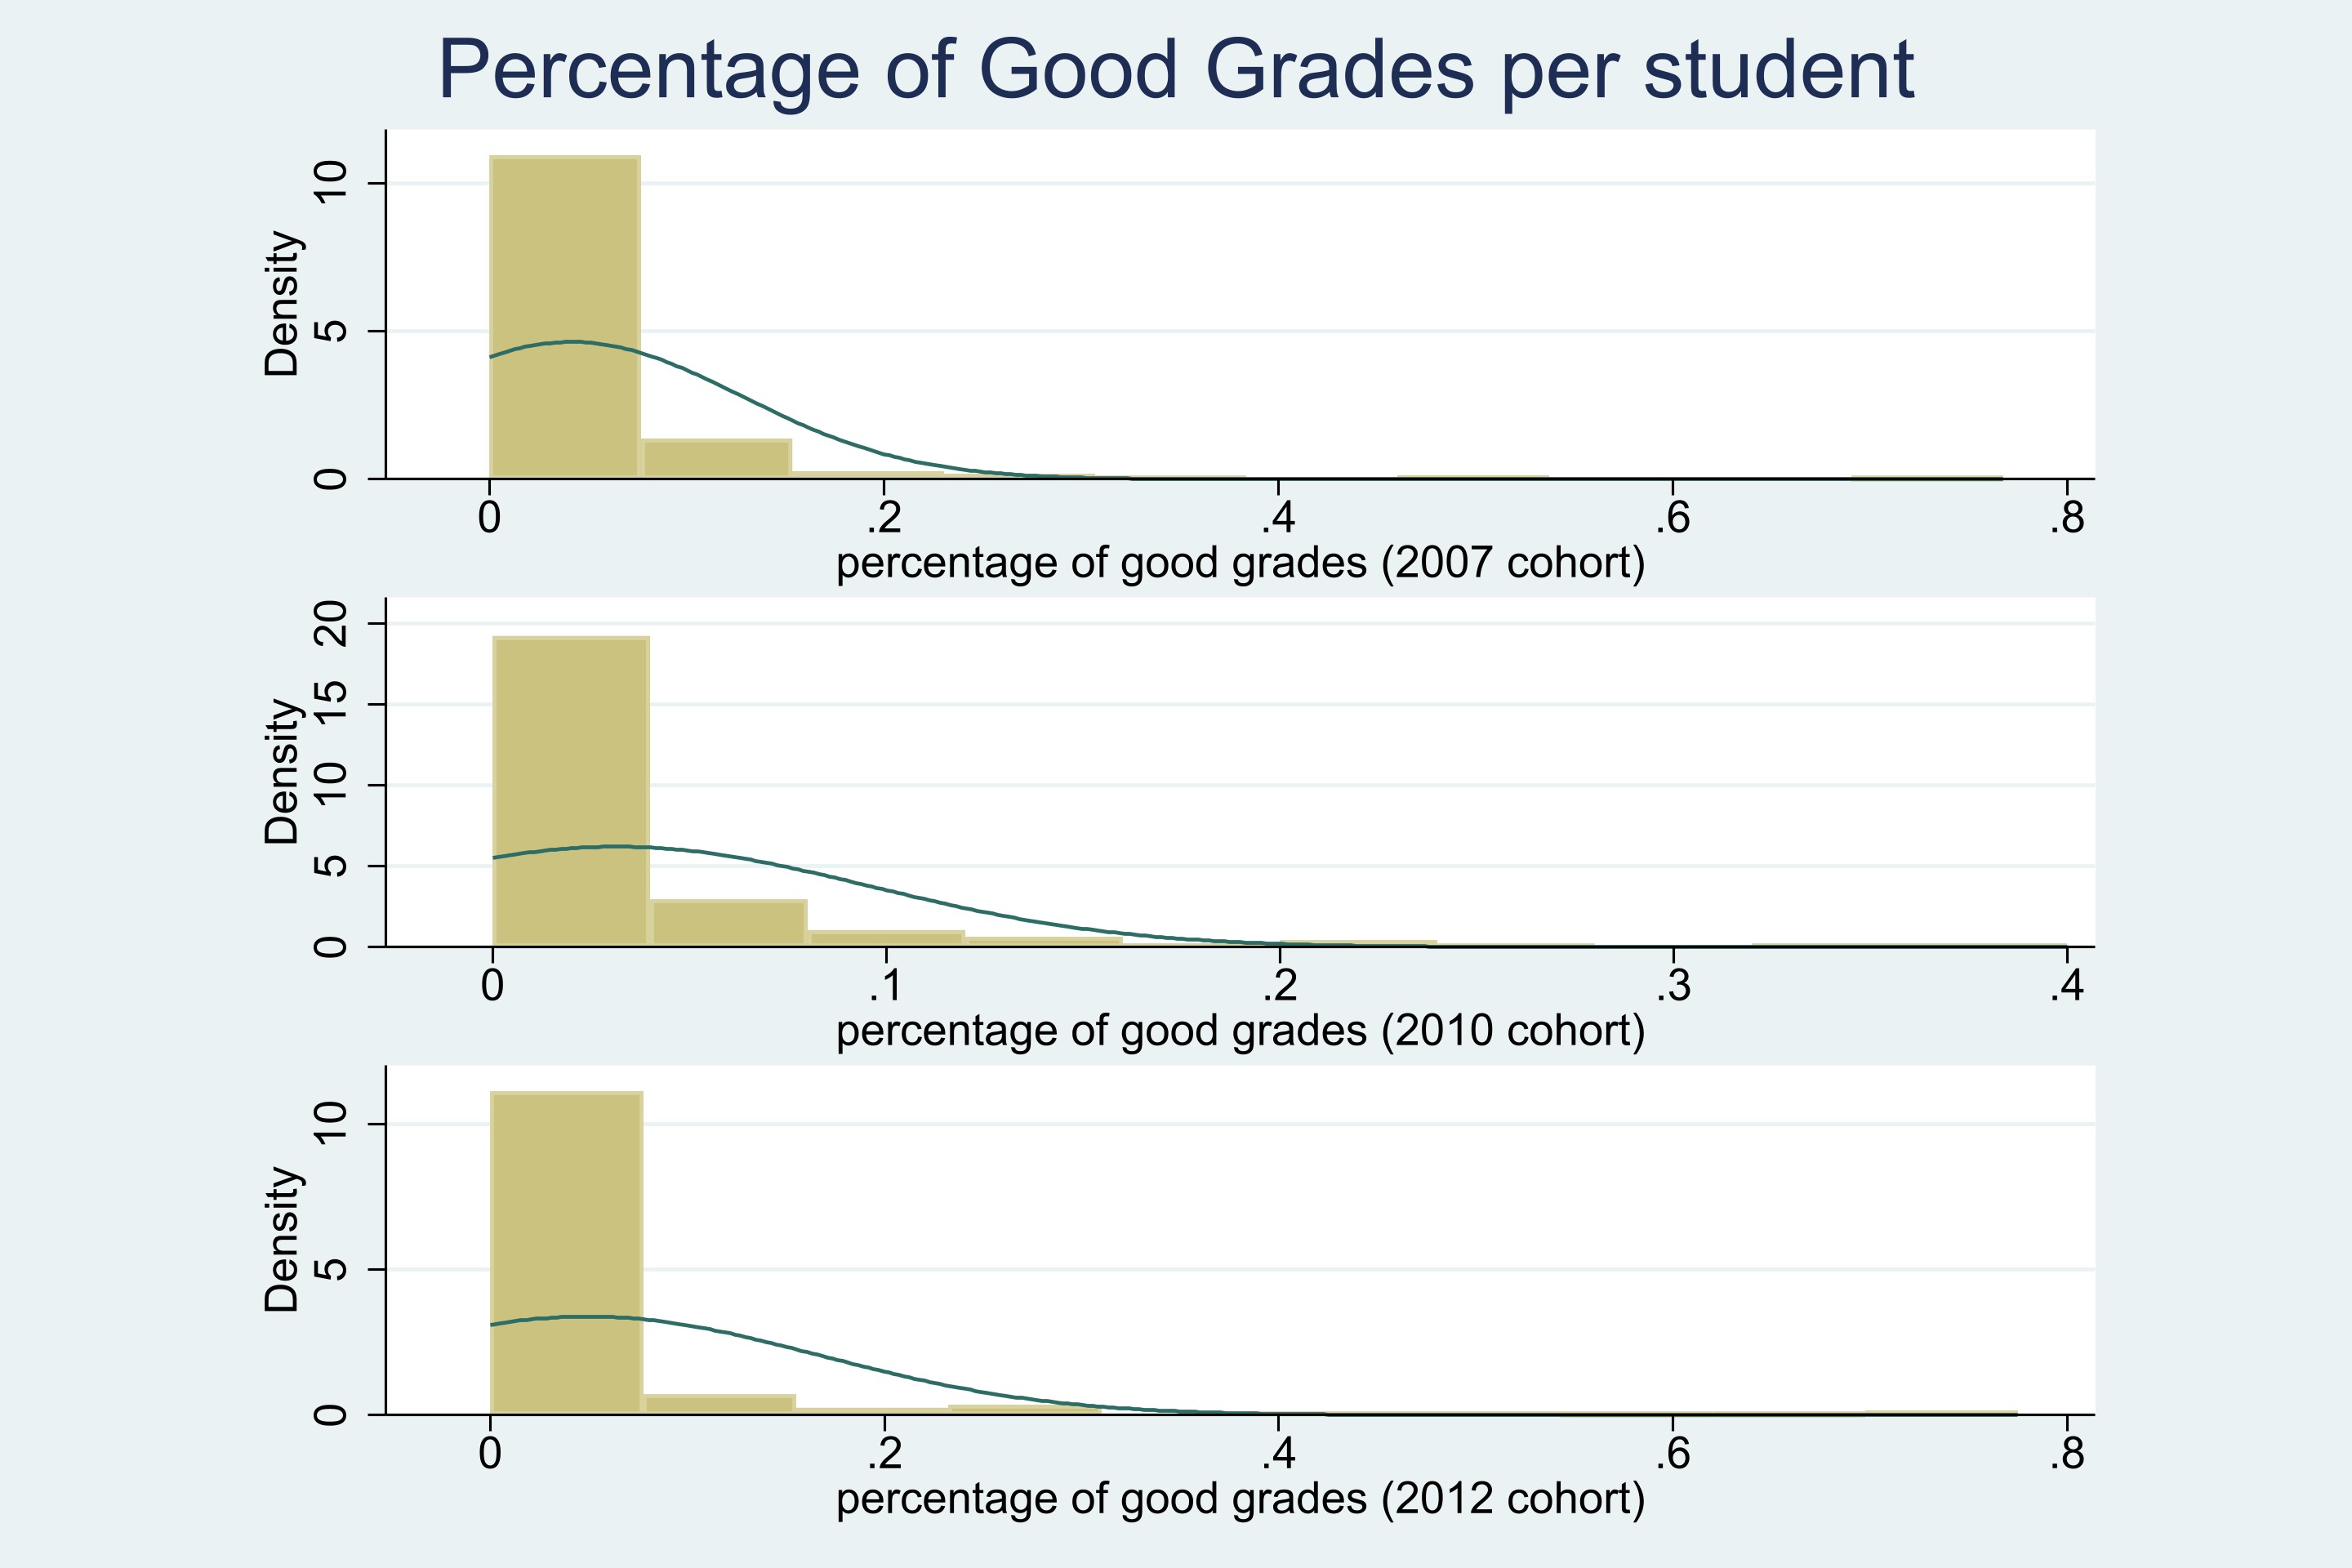
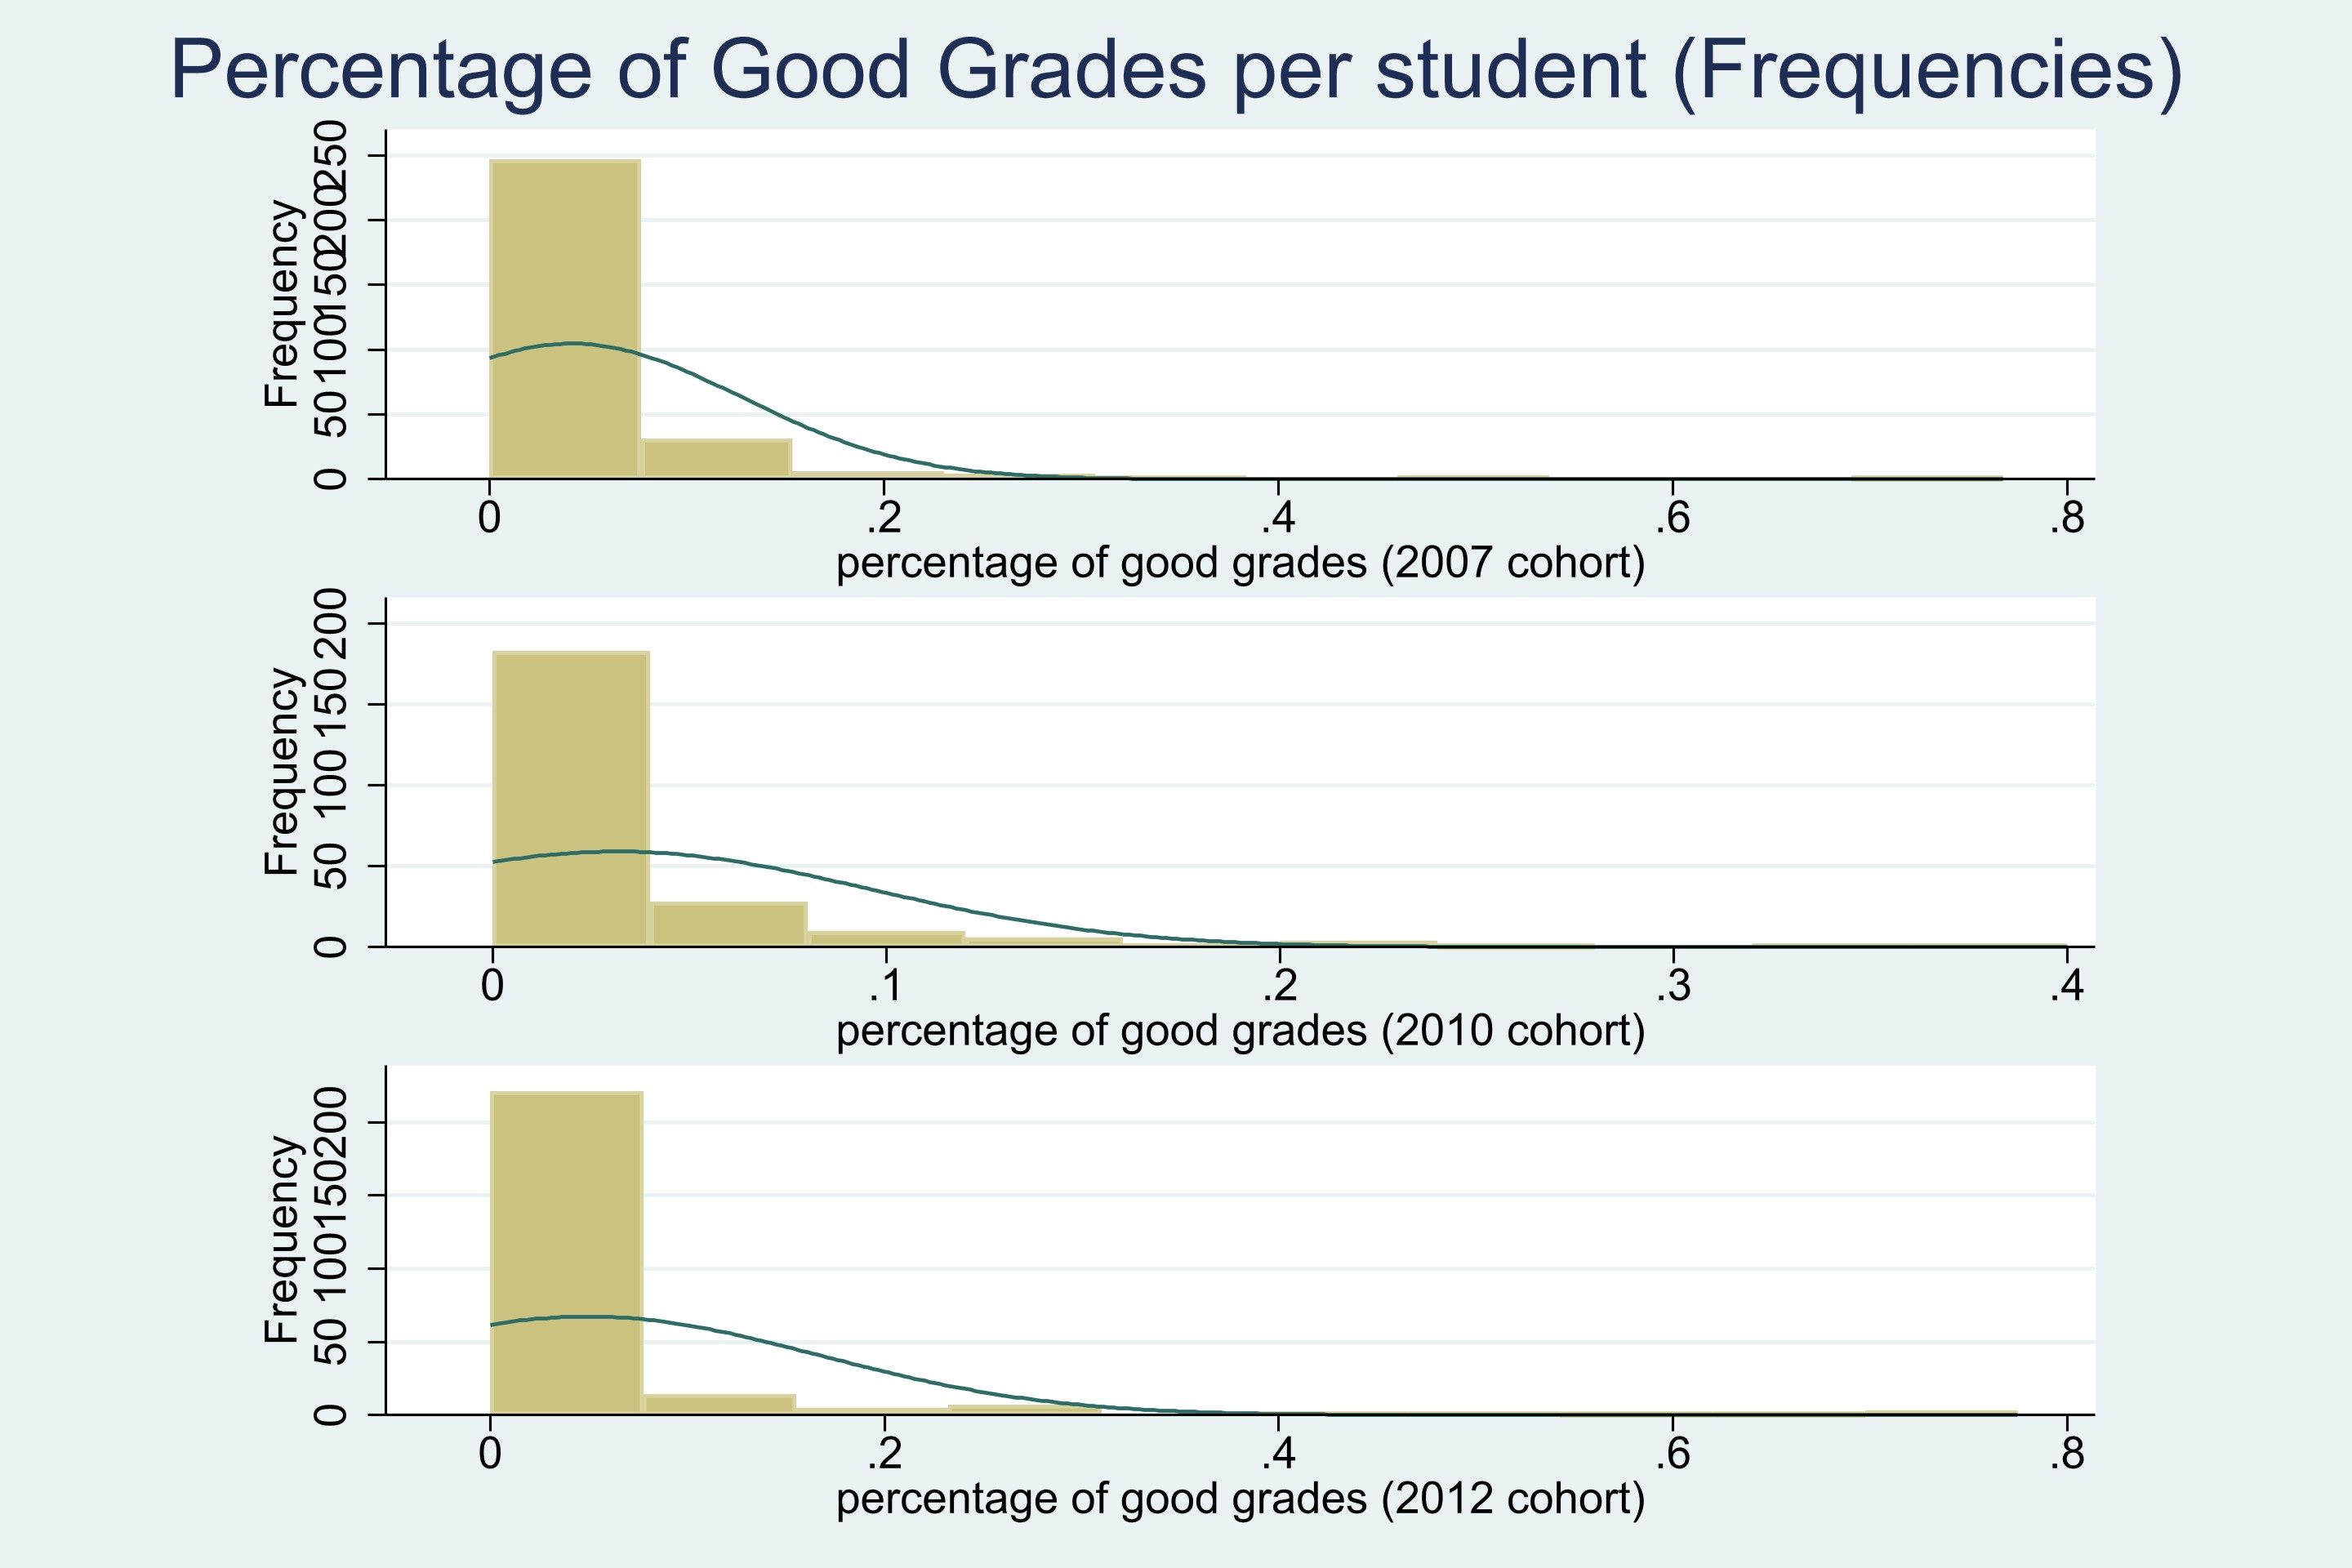
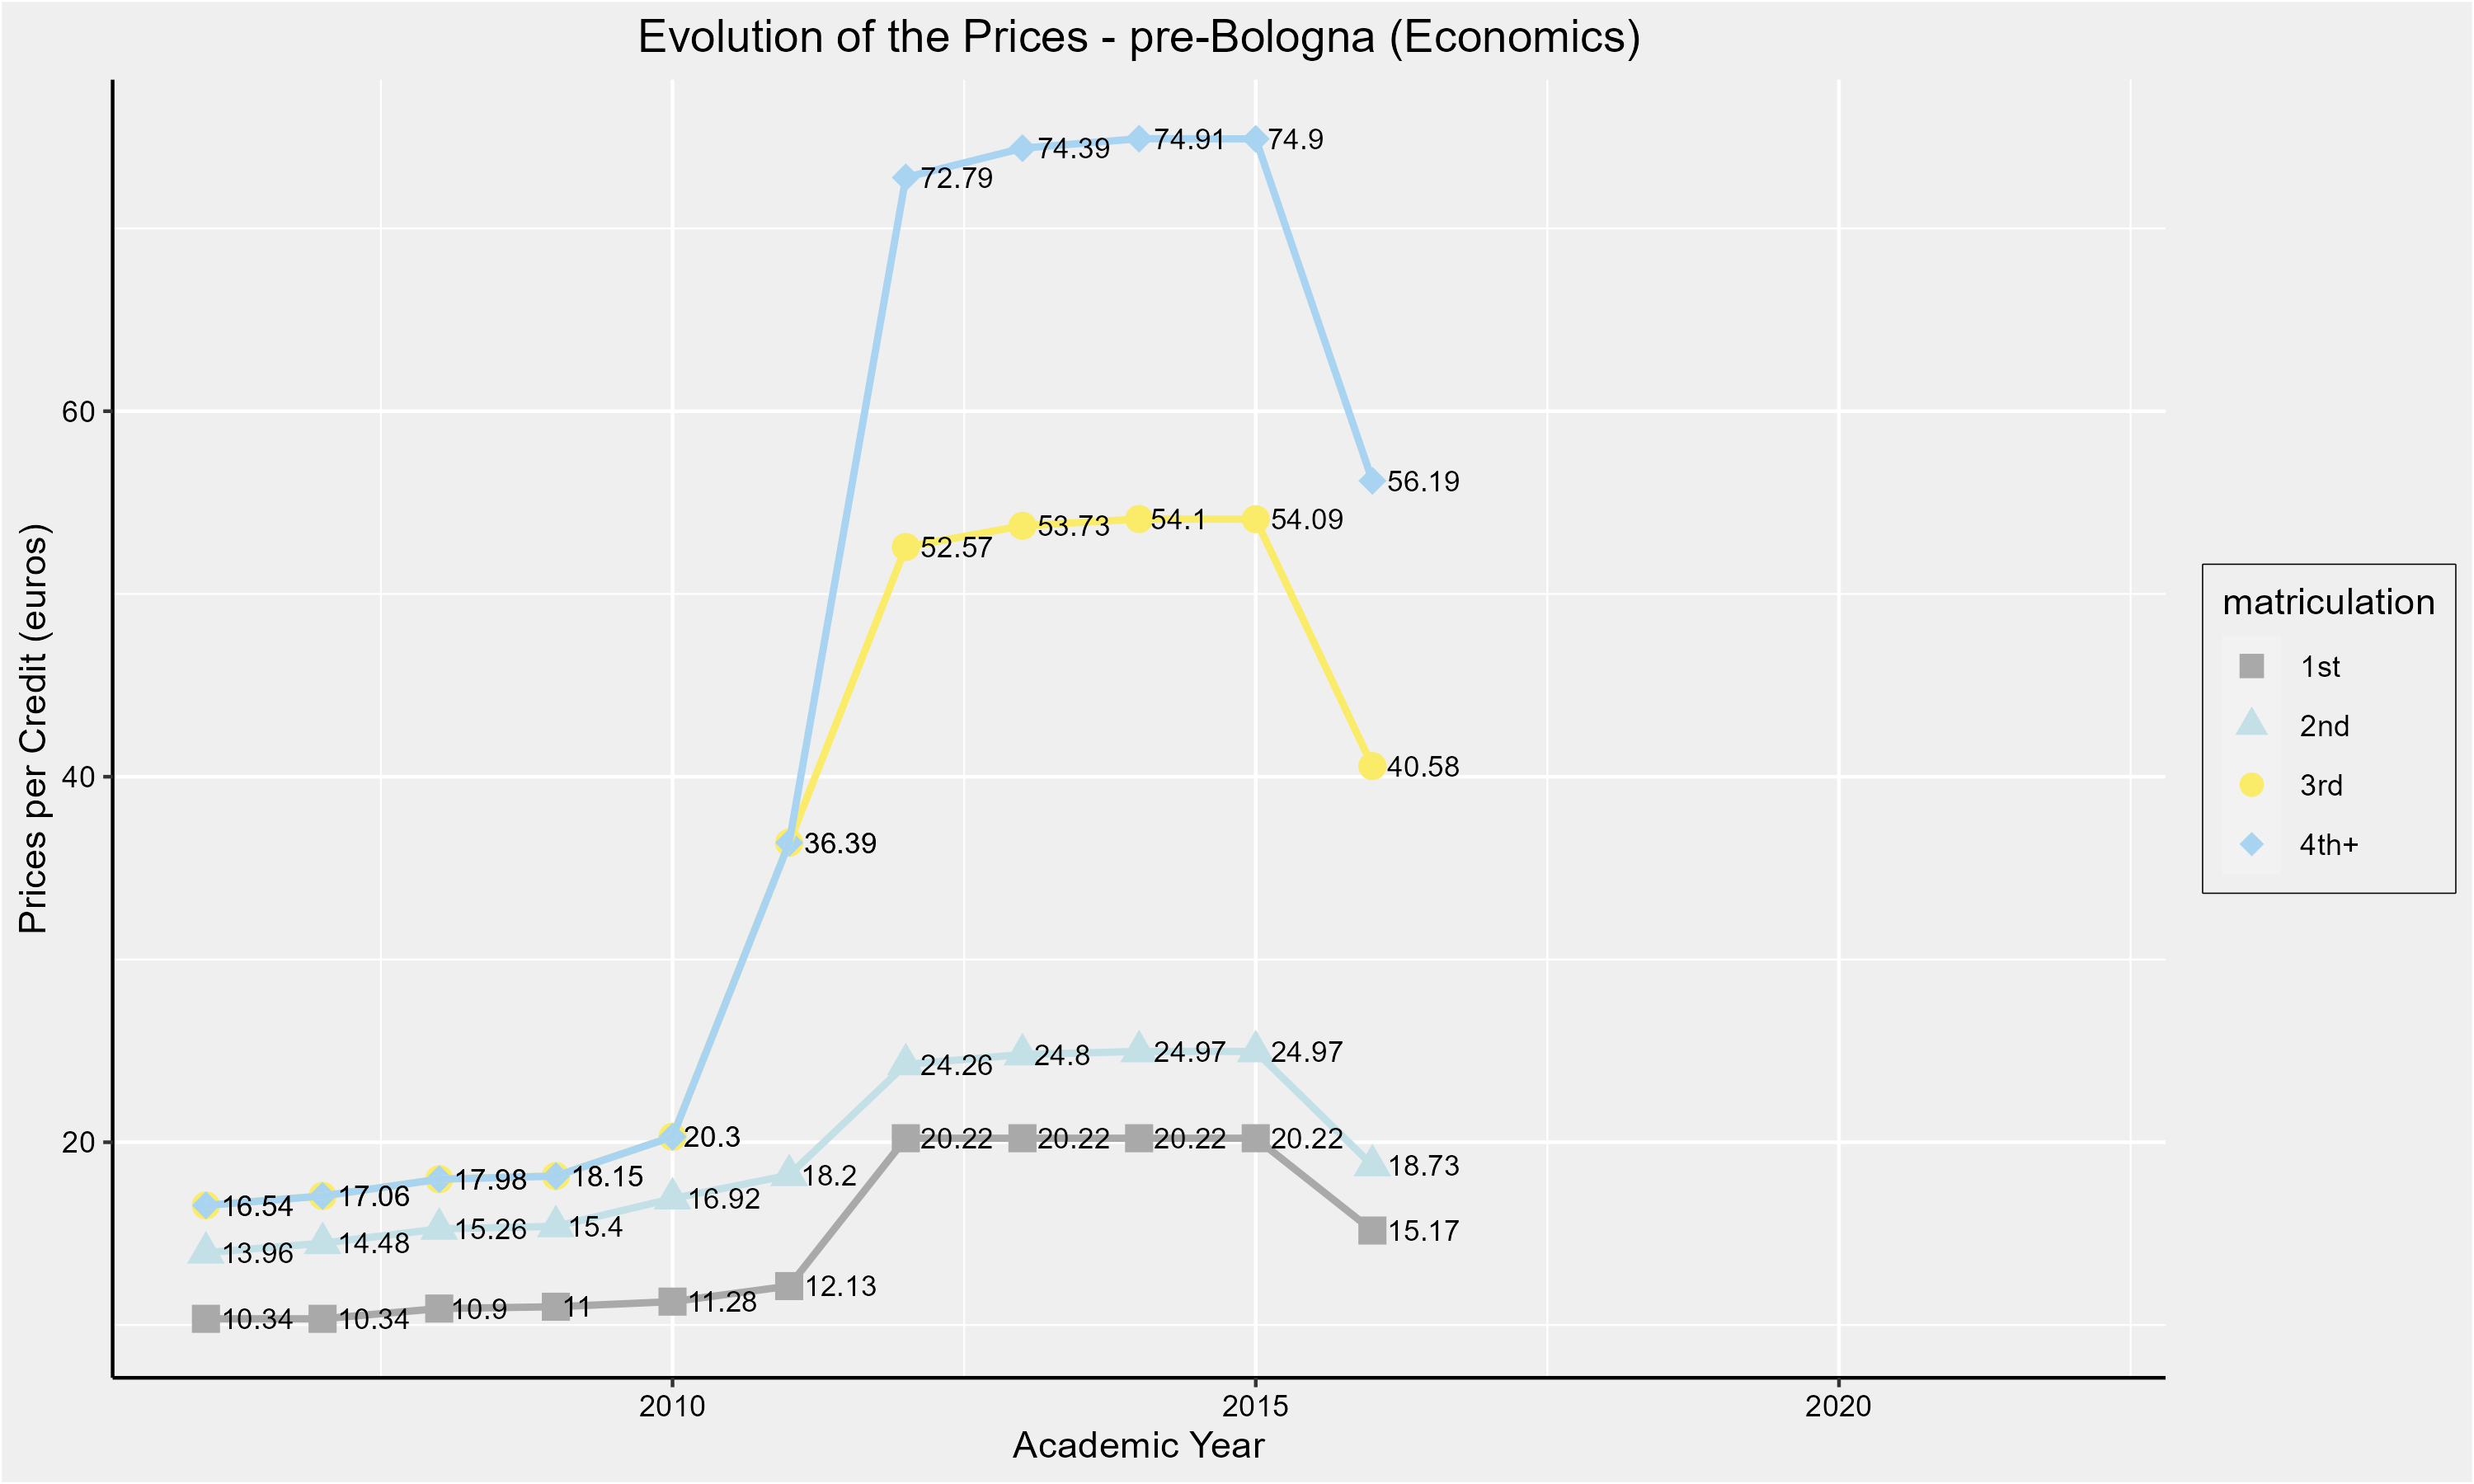
We see no systematic change across cohorts. Raising costs does not seem to motivate students to earn a better grade (or maybe there is a limit of percentage for 9+?).

Note: Here I define "good grades" as E(xcellent) and H(onorable) in the first chance taking the exam.

4-3 Percentage of Bad Performane per Student (Final Chance).

Percentage of Bad Performane per student

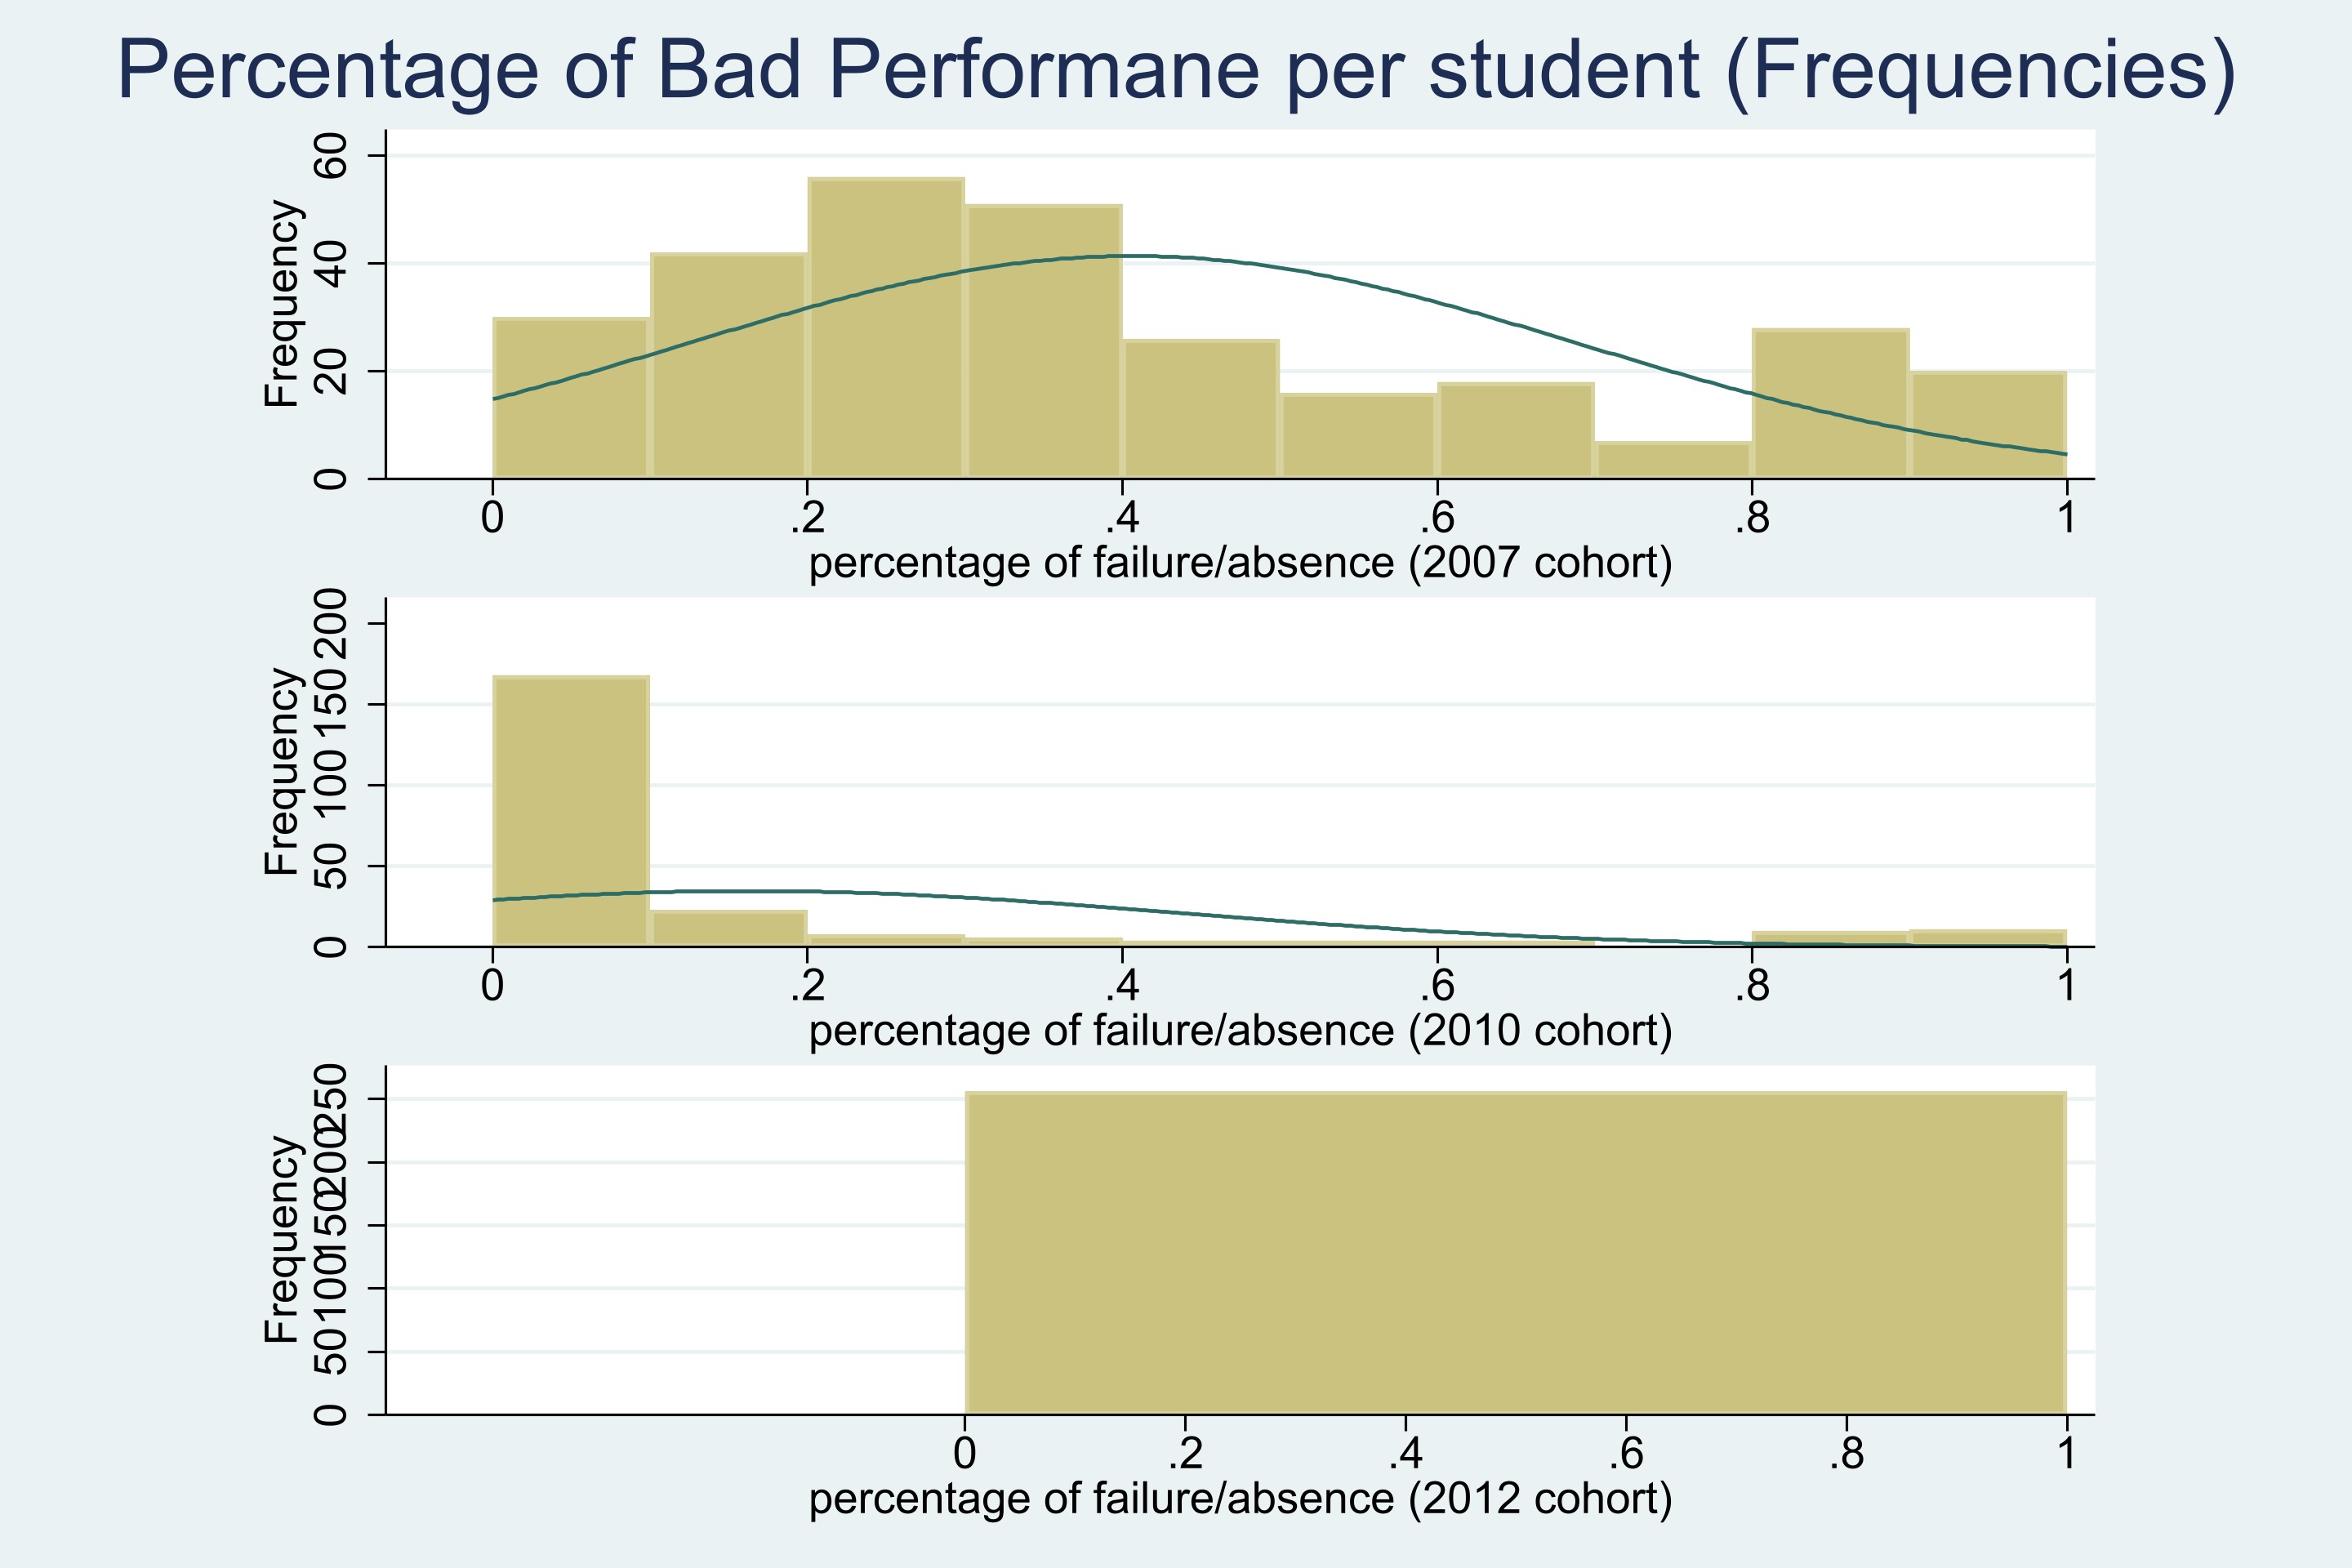
The 2010 cohort has a much lower rate of bad performance than the 2007 cohort.

Note: 1) Here I define "bad performance" as failing or not attending the second and final chance to take the exam.
2) The 2012 cohort is strange here.❗Missing all the grades for second chances. Need to check with data person.

5. Average Time to Pass by Course

Number of Courses Enrolled per Student (Compulsory)
 Number of Courses Enrolled per Student (Compulsory)

Note: Here I use course names instead of course codes to identify course. But still it is very wierd because some people took 100+ courses during their undergrad's. Maybe it's related to the transition from the 20 series to the 36 series. I'll look at it later.

6. Average Time to Pass (Compulsory vs Optional)
     updated with variable TIASEN

Average Time to Pass by Student and Course Type
1. Price Changes in Catalonia 2008 to 2020 - Economics (pre-Bologna system)

Economics
1. Price Changes in Catalonia 2008 to 2020 - Economics (Bologna system)

Economics
2. Price Changes in Catalonia 2008 to 2020: pre- and post-Bologna

Economics
Economics_old

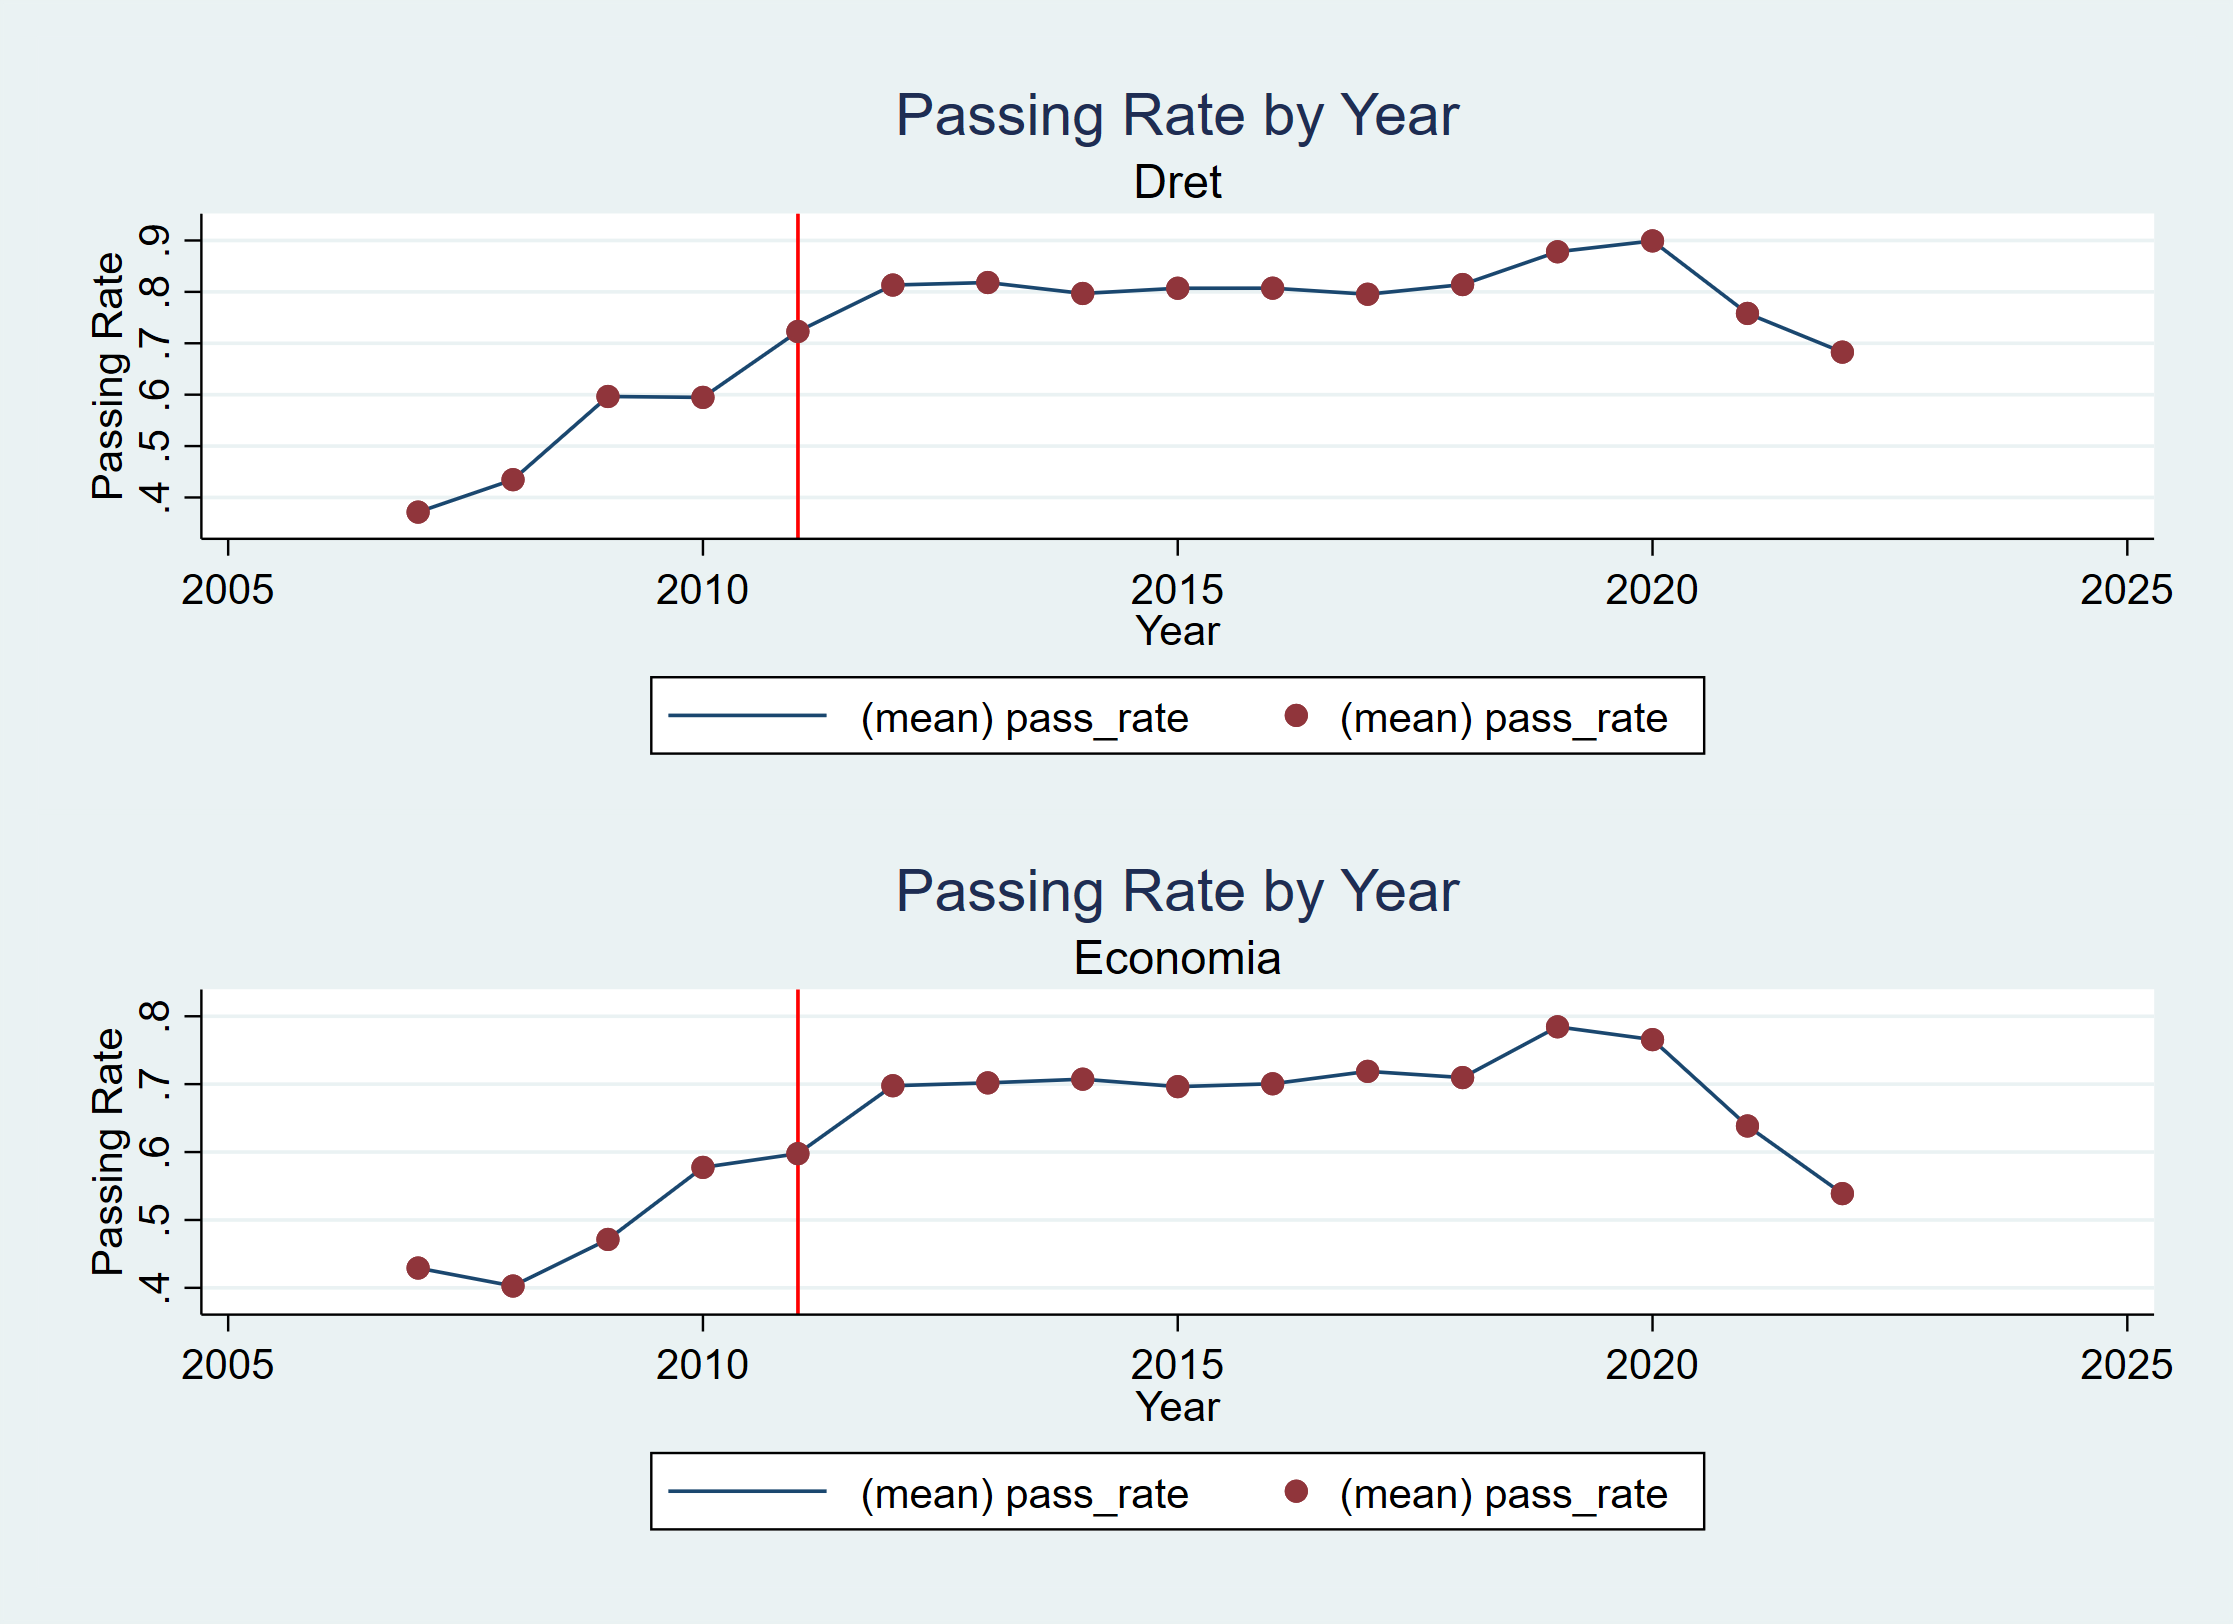
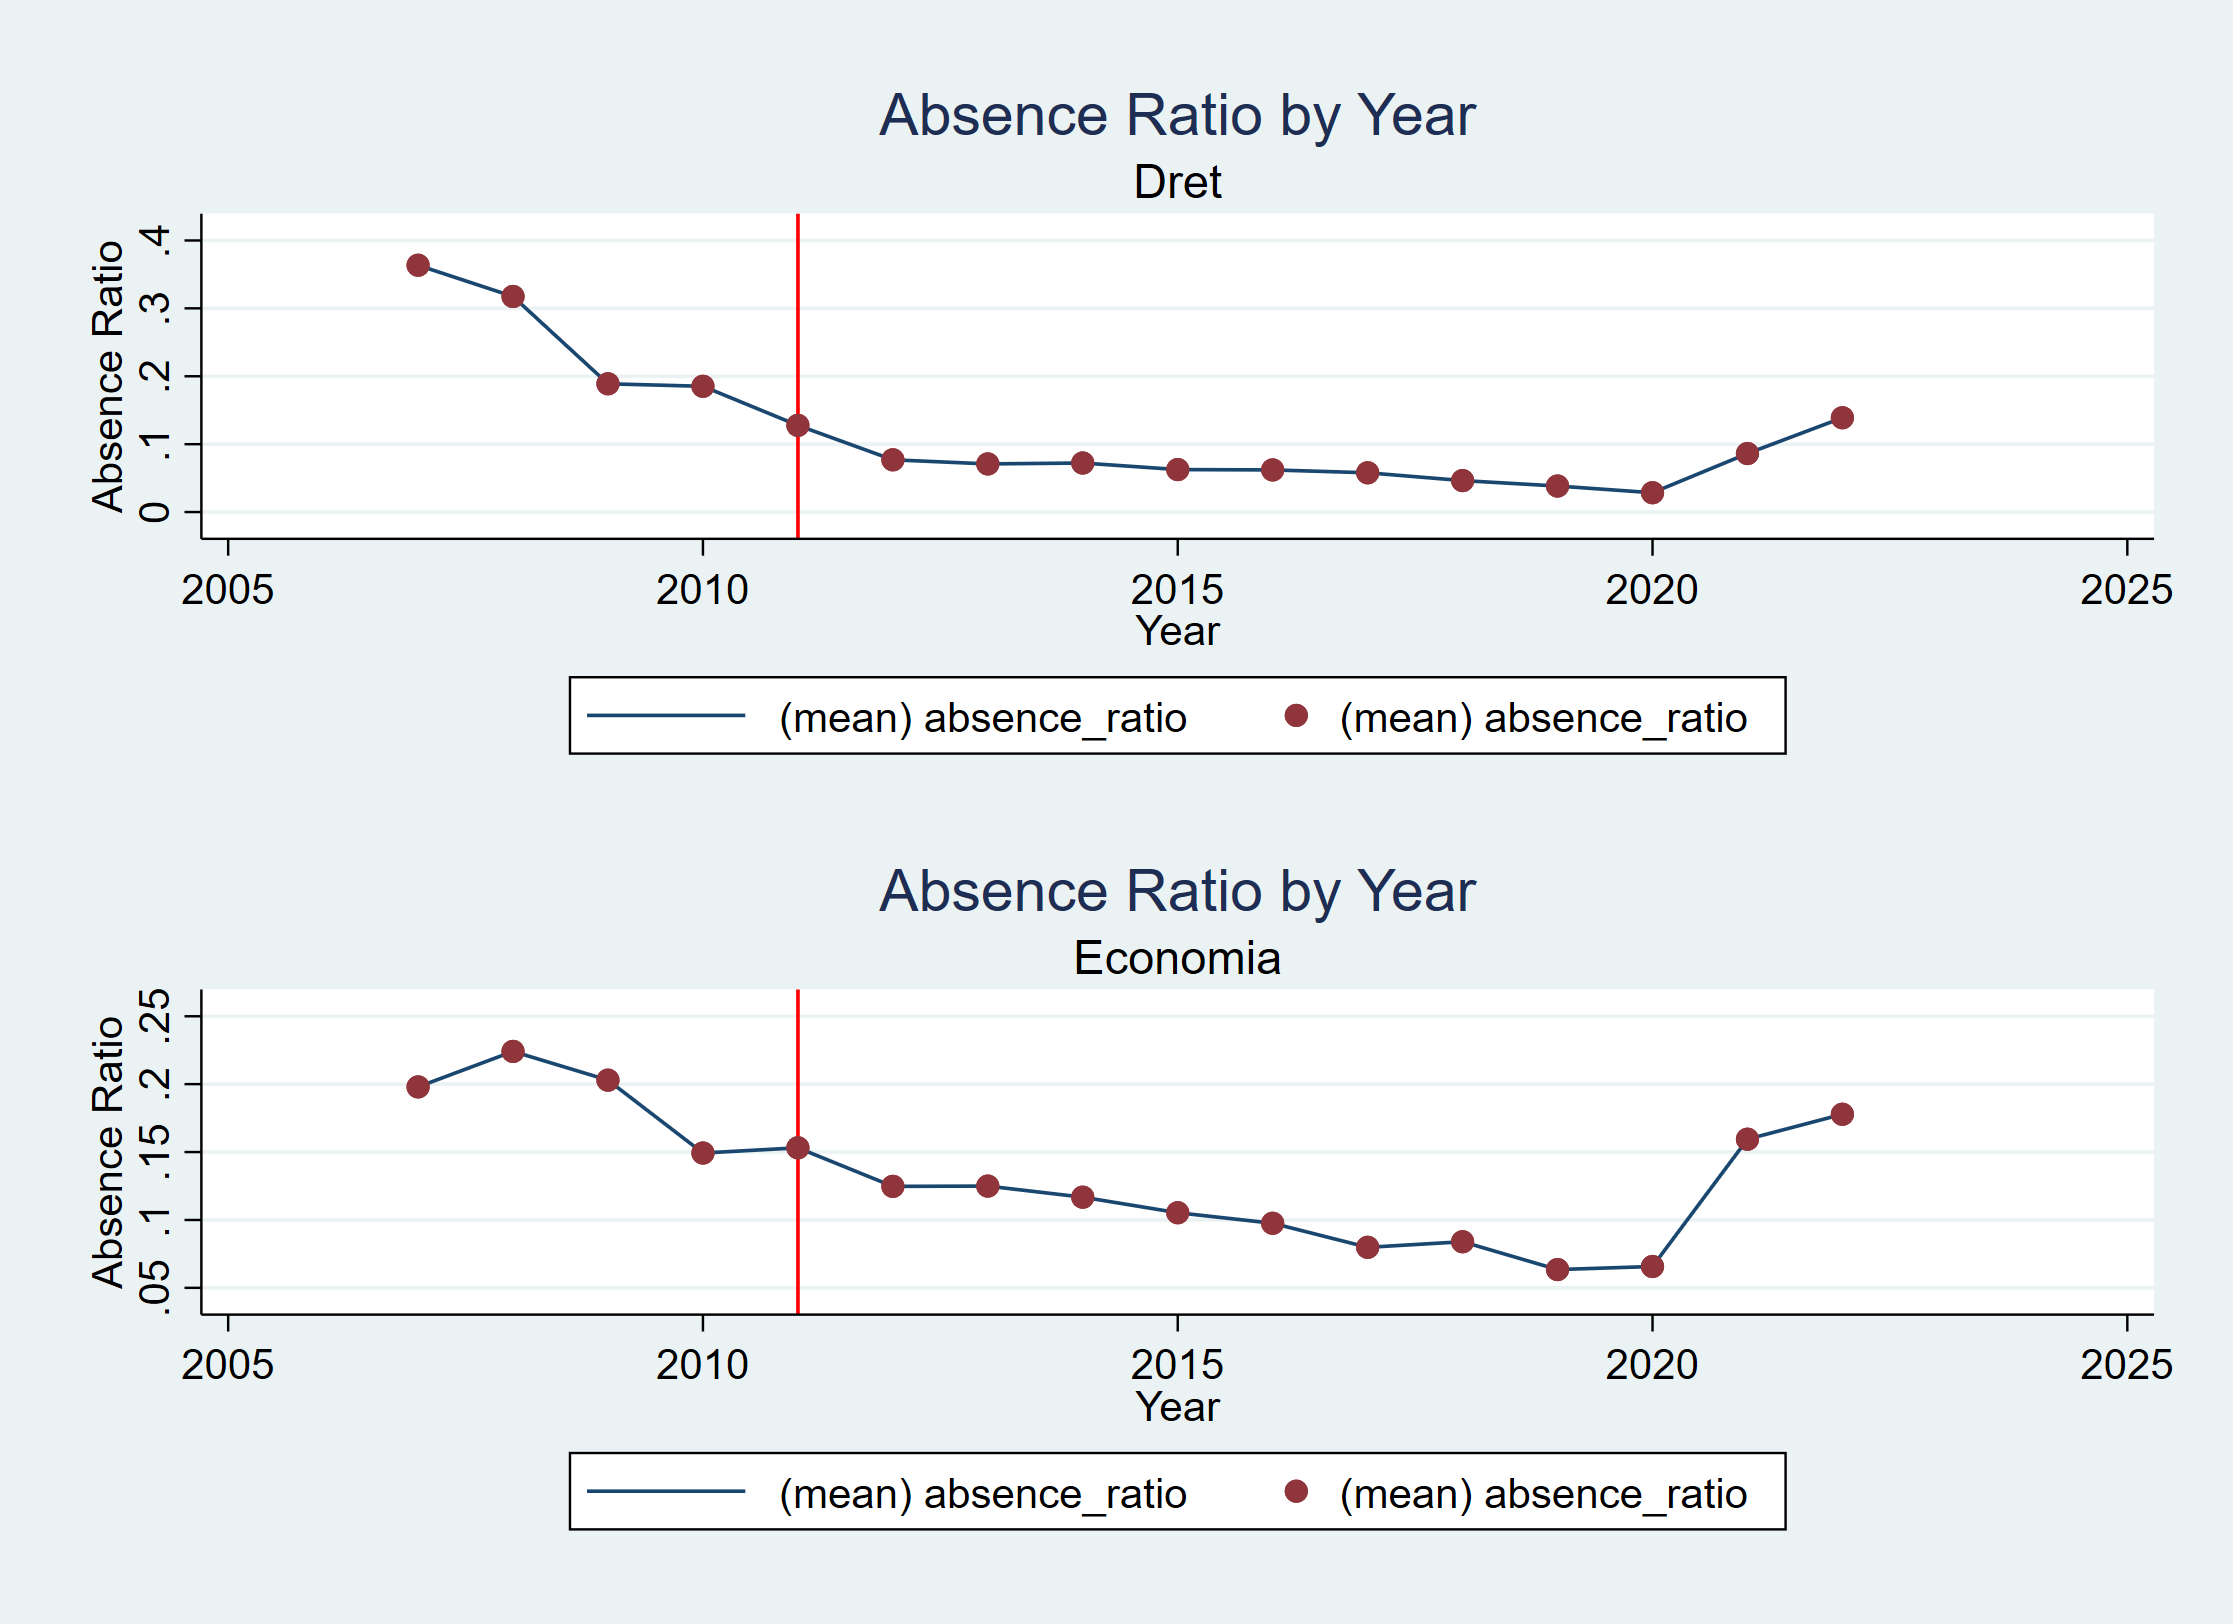
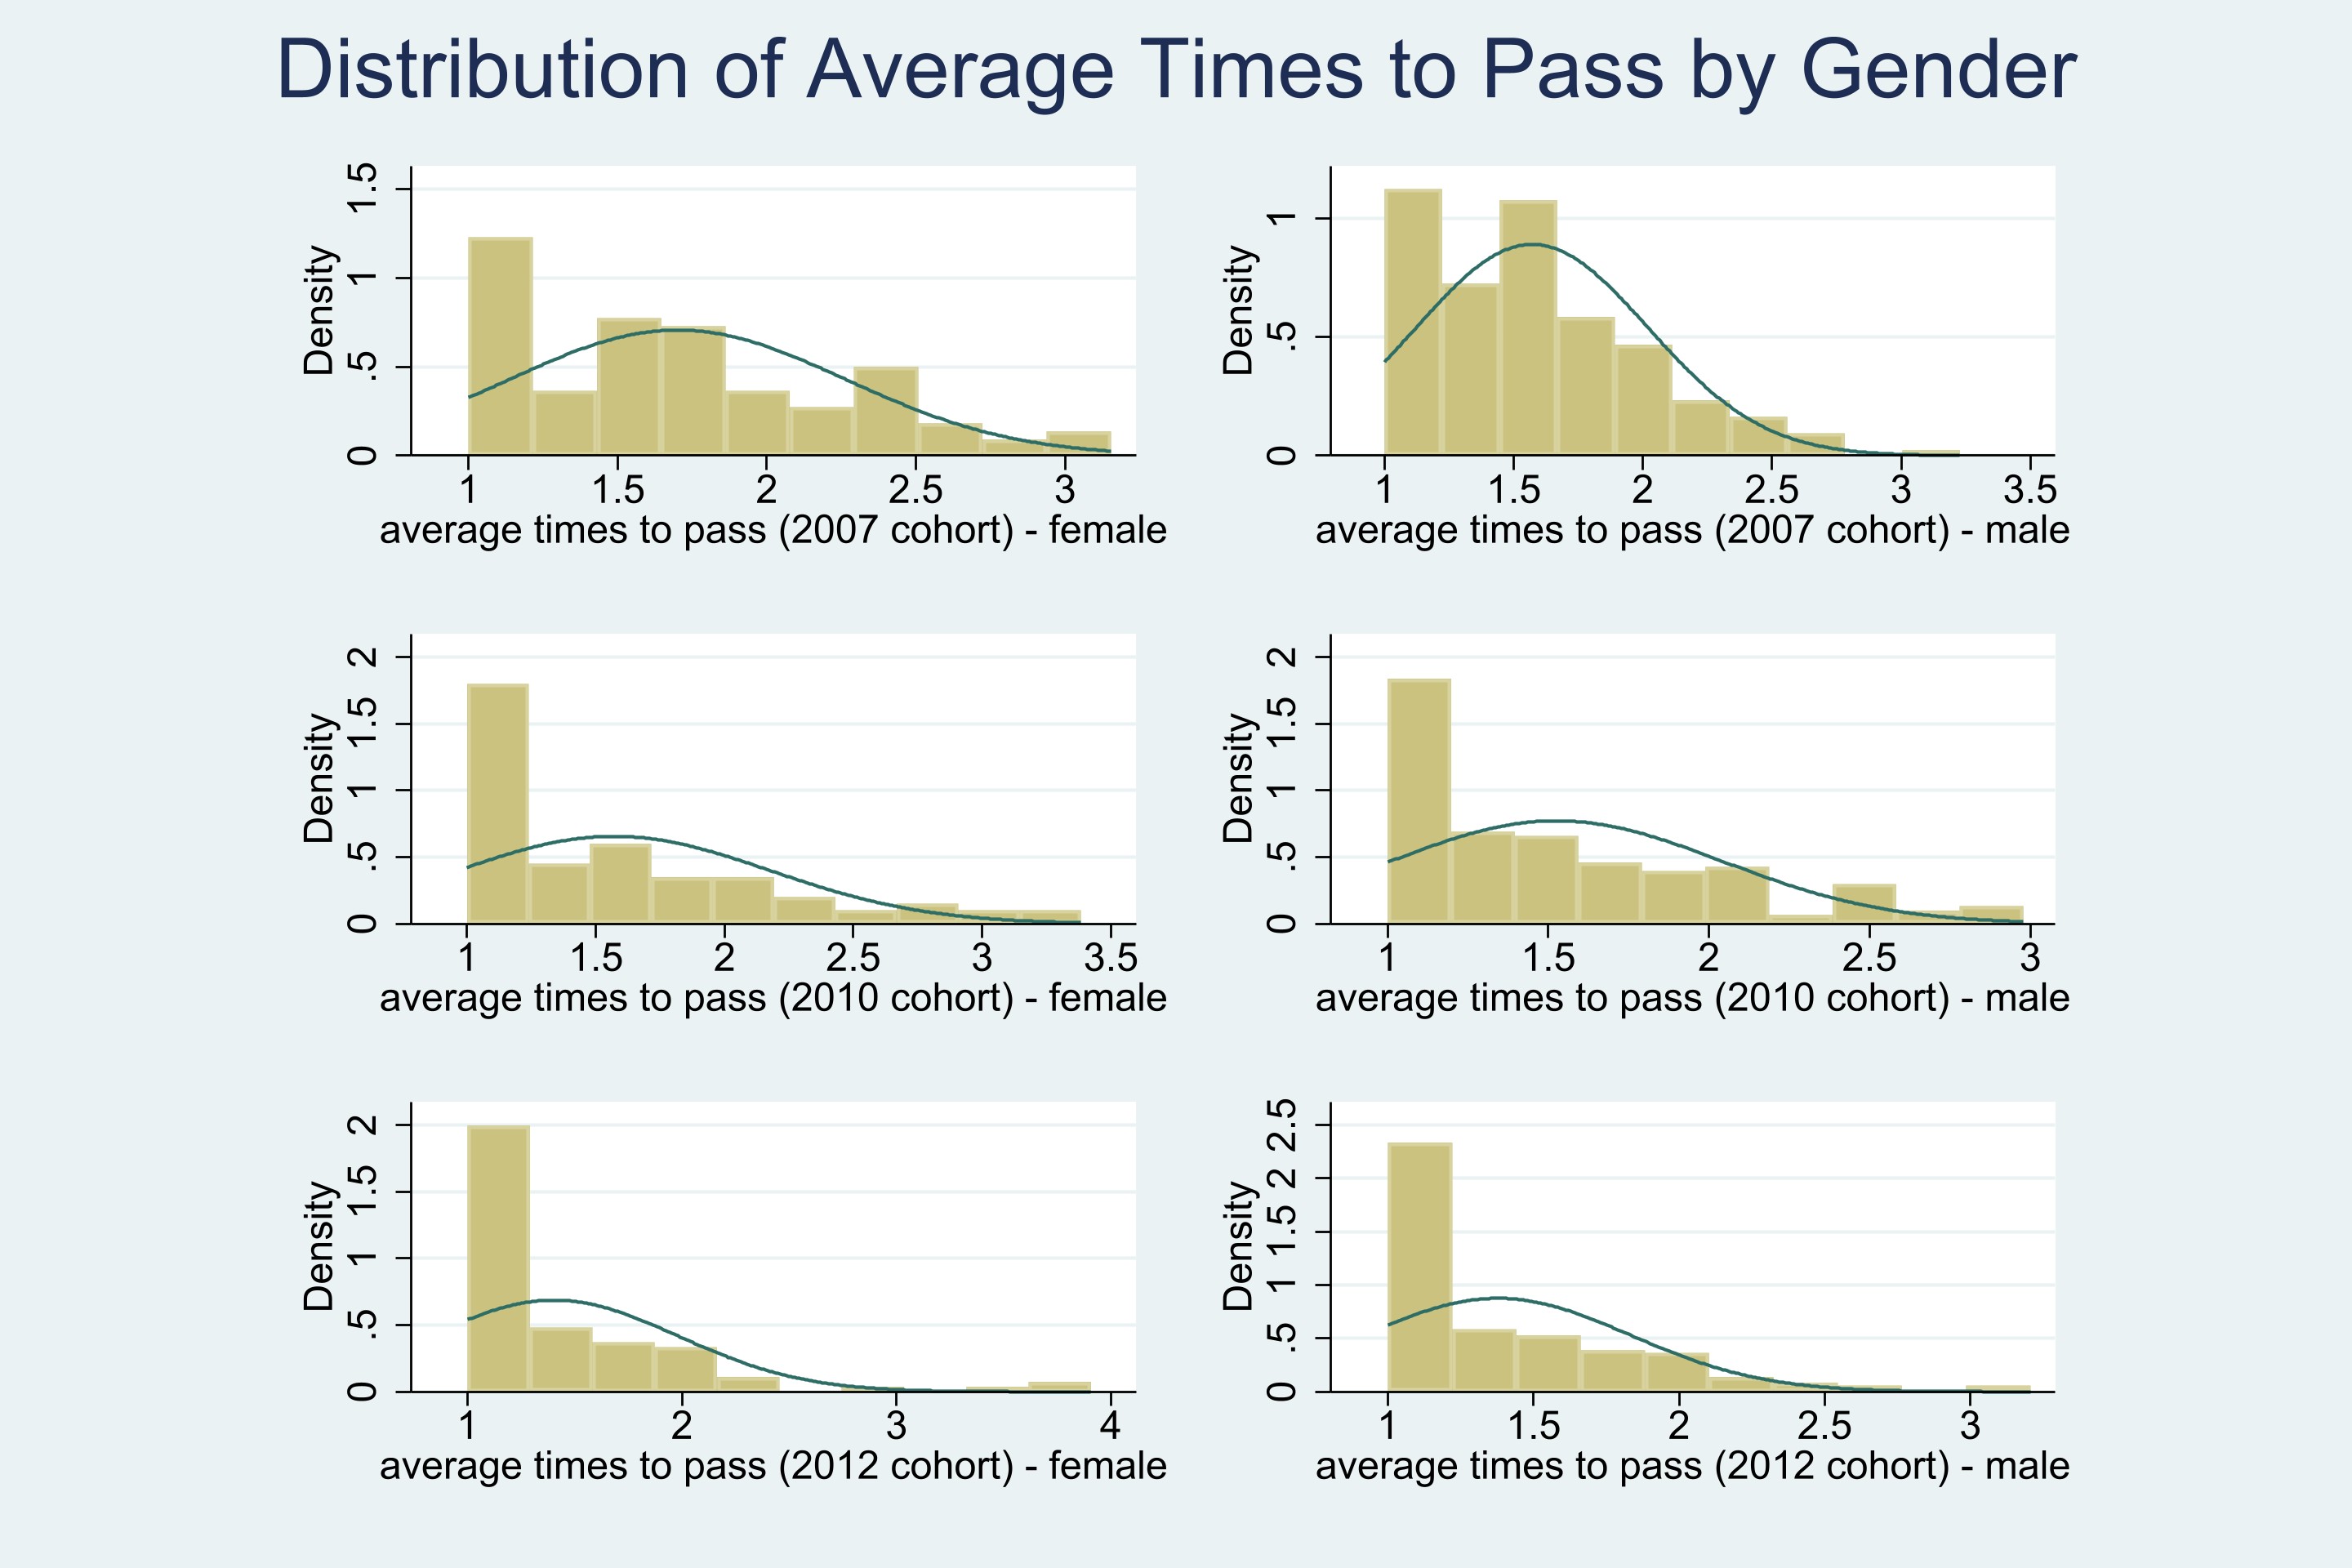
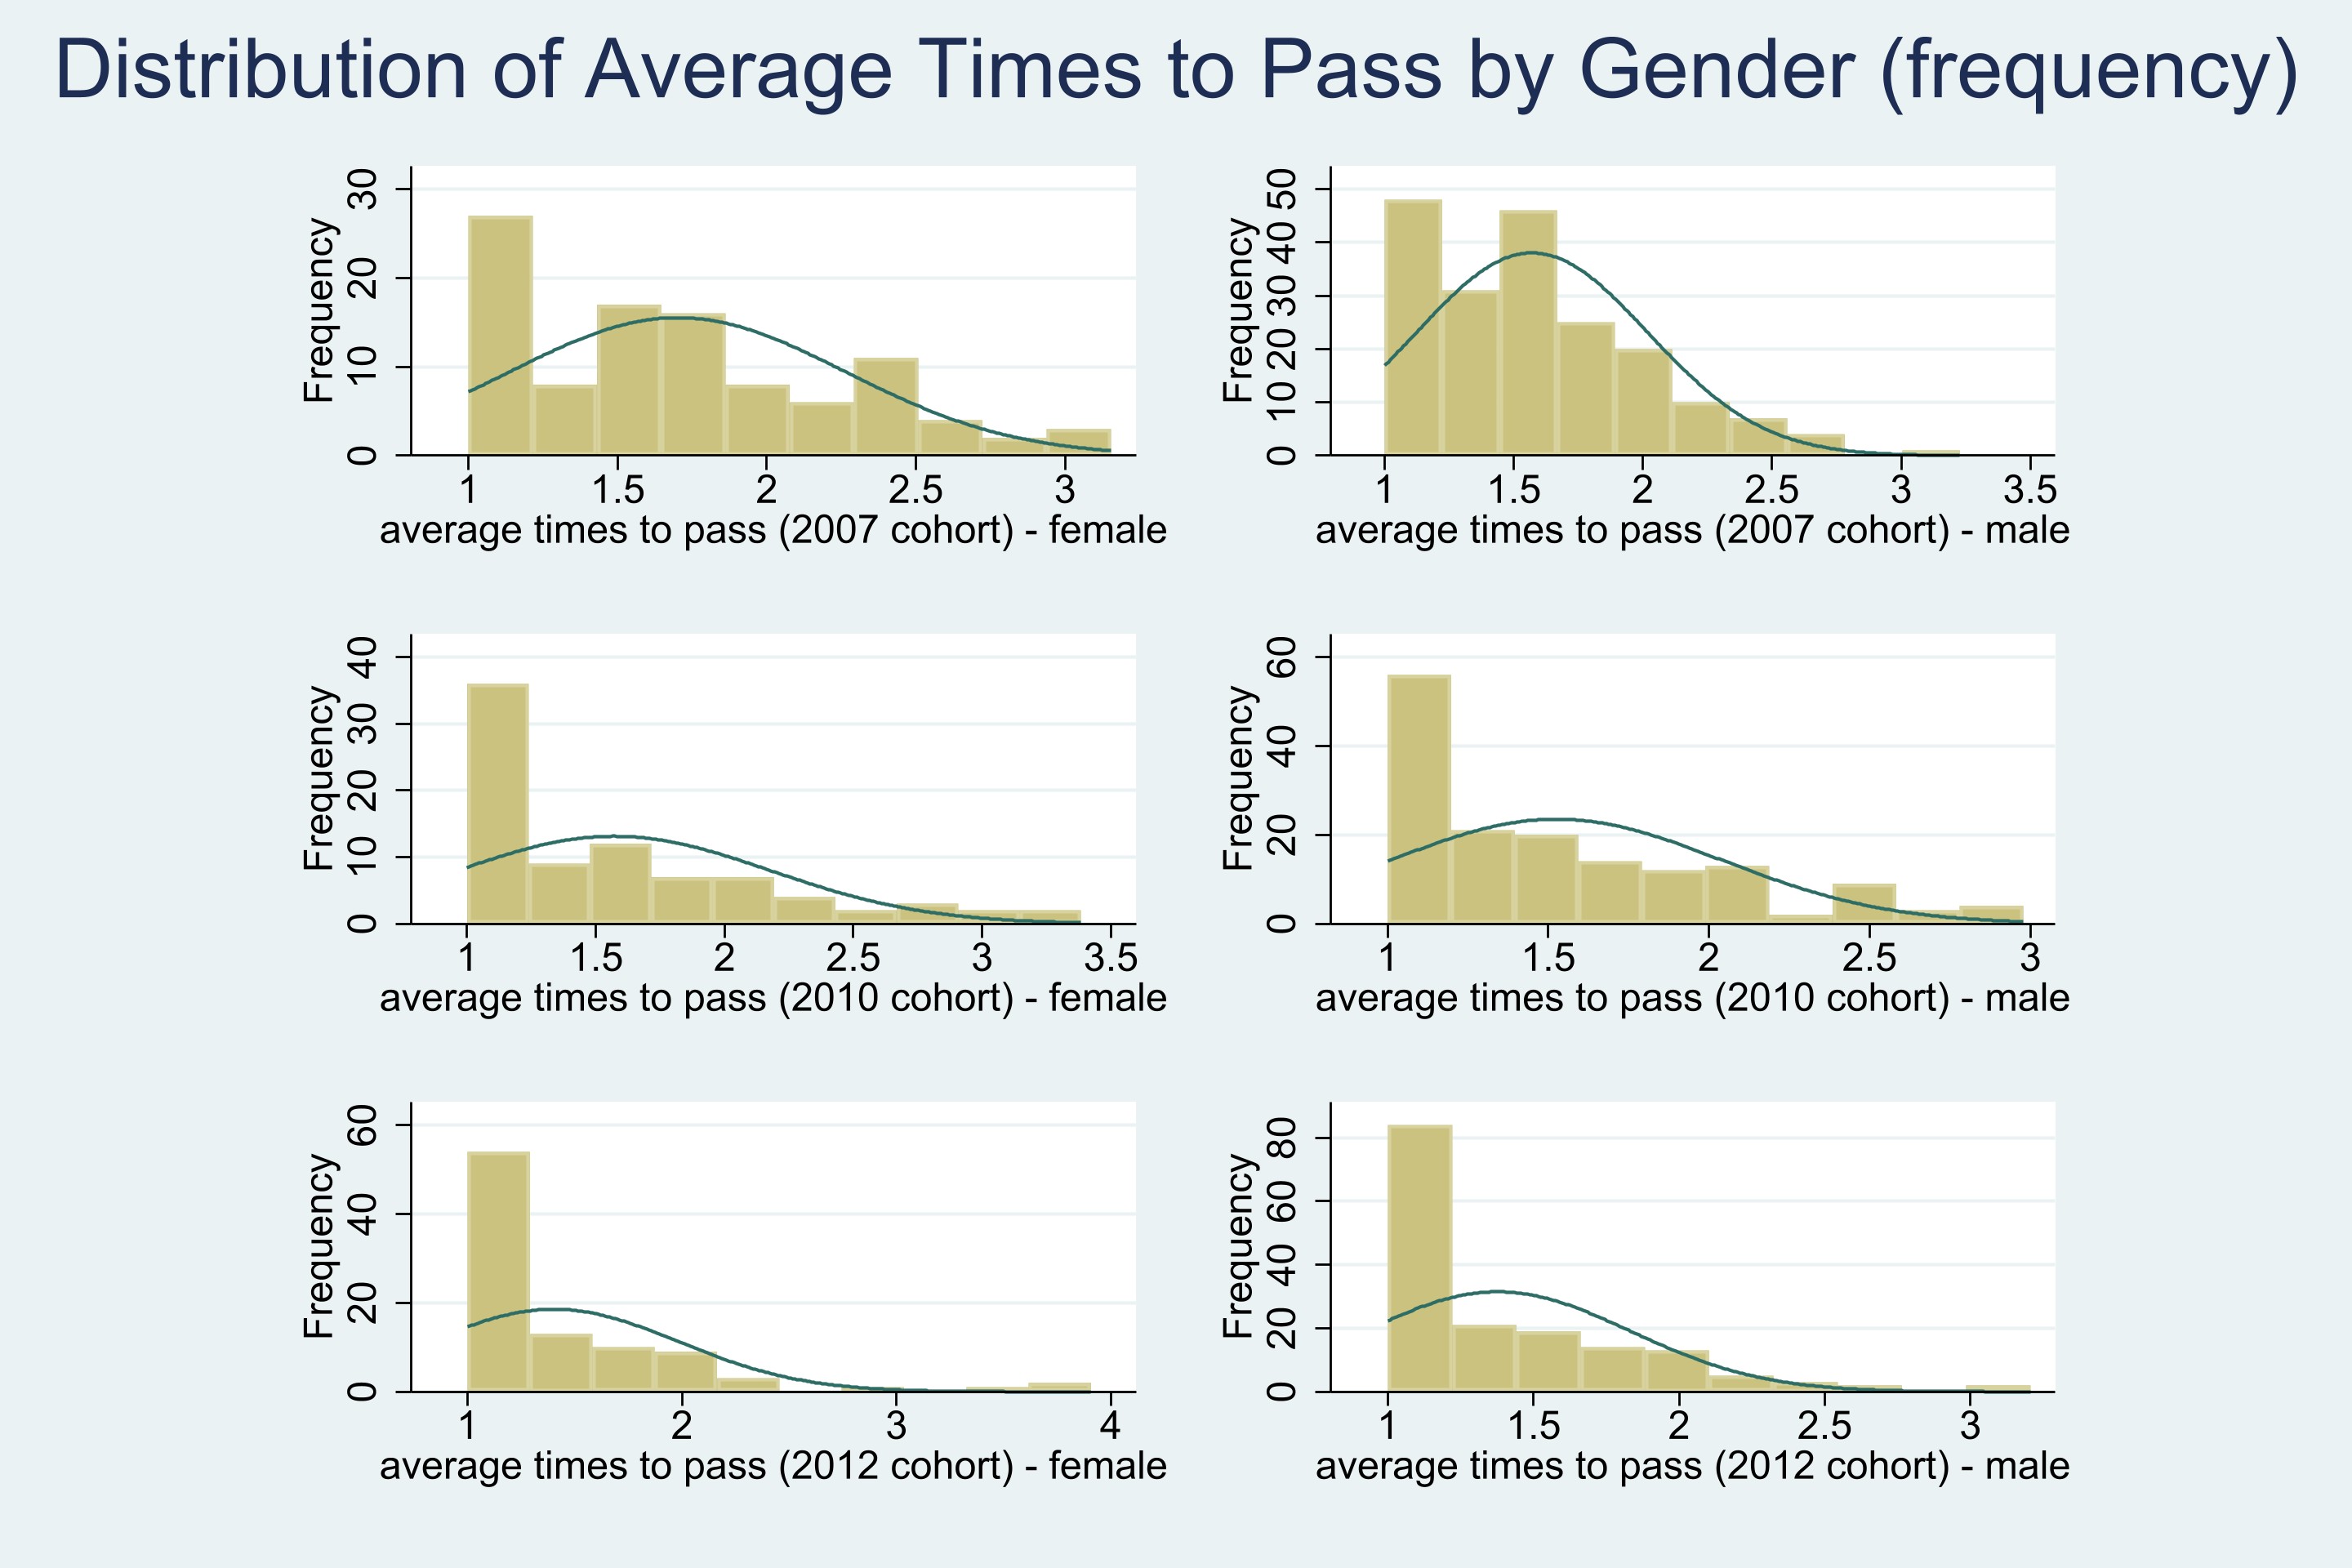
They behave in the exact same way!

3. Price Changes in Catalonia 2008 to 2020 - Economics vs Human Biology (Bologna System)

Economics
Human Biology
5. Number of registration (student-course).

No. Times 2007 Cohort 2010 Cohort 2012 Cohort
1 6,257(74.51%) 5,552(81.57%) 5,552(86.48%)
2 1,396(16.62%) 782(12.69%) 643(10.02%)
3 506(6.03%) 242(3.93%) 164(2.55%)
4 and more 239(2.85%) 111(1.80%) 61(0.95%)